Aug. 23, 2022

Best Time of Year to Sell a Home

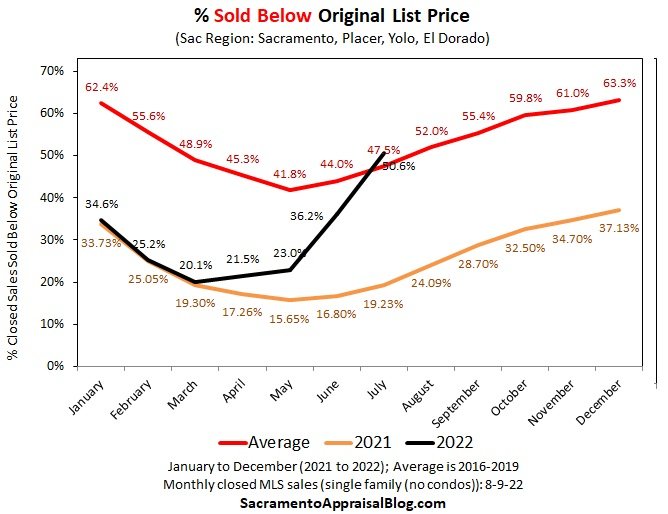
This graph does not lie! If a Realtor tells you it does not matter when you list your home, think again! Notice how the red and yellow lines dip in May and increase through December. The best time to sell a home is March 1st through the end of May. Even the first part of June is alright.
On average, about 41% sold below list price. While in December it increases to about 63%. Remember, this is the average over many years.
In 2021 (the yellow line), about 16% sold below the list price in May. In December, this number increased to about 37%
If you want the most for your home, let's put together a plan just for you. Reach out, and let's talk.
This graph was from sacramentoappraisalblog.com Thank you, Ryan Lundquist
Posted in Real Estate News
Aug. 9, 2022

Antelope Housing Market Sales Data as of August 2022 ???????? ???? ????

Antelope Housing Market Data for August 2022

.

Median Housing Market Data

.

This housing market has changed!!!  Antelope home prices are up 👆 just 2% from July 2021.  Comparing home sales in May this year to July, home prices are down 👇 10%.  These numbers are in red below.

.

A sign of a slowing housing market is the DOM increasing.  In Antelope, it has not increased that much yet.  Other areas around Sacramento have increased significantly.  I expect this to increase next month.

.

Inventory is going up.  This time of year, it’s normal for it to increase.  These numbers are highlighted in green below.  The active listings (inventory) have continued to increase over the last few months.  With more competition, you CAN'T price your home as high.  Look at home sales in July.  Only 26 homes sold, while last year 73 sold.

.

The time of year affects the housing market and the interest rate hikes.  Once the children go back to school, the housing market will usually cool off.  It can even take a significant drop.

.

Multiple offers are another area that will show a housing market change.  In May, the pending homes had 56% with more than one offer.  That dropped 👇👇👇 to 46% in June, and in July, 43%.  This pending will be the first area for this number to change.

.

The housing market has changed, and it’s important to stay ahead.  If you are buying a home, DON’T OVERBID.  If you are selling, DON’T GET TOO AGGRESSIVE.

.

**If you are buying a home, don’t overbid.  I expect homes will sell for less than the list price soon.  I have seen home buyers overpay for a home by 40k or more.  Be careful!

.

Major factors that go into buying a home that needs to be considered.  Are the expensive things such as the HAVC, roof, fencing, condition, and water heater?

.

For more housing information, visit my blog at https://www.allcahomes.com/blog/.


.

May-22


# Listings

List Price

Sale Price

DOM

Active    40

36

$534,450

$0

12

Pending   62

57

$539,000

$0

7

Sold

43

$535,000

$560,000

7

Sold 2021

60

$470,950

$496,000

6

June-22


# Listings

List Price

Sale Price

DOM

Active

57

$529,900

$0

18

Pending

33

$506,125

$0

15

Sold

55

$529,000

$525,000

7

Sold 2021

48

$449,000

$468,500

5

July-22


# Listings

List Price

Sale Price

DOM

Active

75

$508,000

$0

18

Pending

42

$544,000

$0

15

Sold

26

$499,000

$502,500

11

Sold 2021

73

$459,950

$490,000

7

I want to put you in the best possible position to get a home at the best price.  I have a method to get you the best price possible on a home without over-biding.  Please feel free to give me a call, text, or email me to find out how my system works.

.

We can put a plan together to save you as much money as possible in these circumstances.  It is possible that waiting to buy or sell a home may help you have more fruit later.  Your family home is one of your largest investments.  It's my job to ensure that it yields the highest ROI.  That means making smart decisions that will yield fruit in the future.  Planning is the best way to make this happen.

Posted in Real Estate News
Aug. 9, 2022

Fair Oaks Housing Market Data as of August 2022 ????????

Fair Oaks Housing Market Data for July 2022

.

Median Housing Market Data

.

Fair Oaks housing prices are down 👇 2%.  This is comparing July home sales this year to July last year.  Comparing home sales in May 2022 to July 2022, prices are down 👇 1%.  The housing market has changed 💦🔥💦🏡.

.

Other signs that the housing market has changed.  The DOM has increased each month.  This is highlighted in blue below.  In Fair Oaks, it’s now taking a month to get your home under contract.  I believe this number will increase more.

.

Multiple offers are another area that will signal a housing market change.  It will first show in the homes that are pending.  In May, 58% of the pending homes had more than one offer.  That dropped to 45% in June and July to👇👇👇 35%.  Again, signaling a housing market change.

.

Of the homes that sold with more than one offer.  May 77%, June 63%, and July 👇👇👇 49% had more than one offer.  Last year July home sales had 63% with more than one offer.

.

There have been far fewer home sales this year than last year.  July this year had 39 home sales and last year 64.  This is highlighted in green below.

.

The housing market has changed, and it’s important to stay ahead.  If you are buying a home, DON’T OVERBID.  If you are selling, DON’T GET TOO AGGRESSIVE.

.

**If you are buying a home, don’t overbid.  I expect homes will sell for less than the list price soon.  I have seen home buyers overpay for a home by 40k or more.  Be careful!

.

Major factors that go into buying a home that needs to be considered.  Are the expensive things such as the HAVC, roof, fencing, condition, and water heater?  Home sellers no longer have the upper hand when it comes to negotiations.

.

For more housing information, visit my blog at https://www.allcahomes.com/blog/.

.

May-22


# Listings

List Price

Sale Price

DOM

Active   52

50

$768,750

$0

16

Pending    55

45

$675,000

$0

11

Sold  50

43

$595,000

$615,000

6

Sold 2021  74

67

$599,900

$602,000

6

June-22


# Listings

List Price

Sale Price

DOM

Active

91

$739,000

$0

18

Pending

40

$612,500

$0

9

Sold

48

$644,950

$645,000

7

Sold 2021

66

$599,500

$620,000

8

July-22


# Listings

List Price

Sale Price

DOM

Active

74

$704,000

$0

31

Pending

48

$744,000

$0

25

Sold

39

$625,000

$610,000

10

Sold 2021

64

$590,000

$619,500

6

.

I want to put you in the best possible position to get a home at the best price.  I have a method to get you the best price possible on a home without over-biding.  Please feel free to give me a call, text, or email me to find out how my system works.

.


We can put a plan together to save you as much money as possible in these circumstances.  It is possible that waiting to buy or sell a home may help you have more fruit later.  Your family home is one of your largest investments.  It's my job to ensure that it yields the highest ROI.  That means making smart decisions that will yield fruit in the future.  Planning is the best way to make this happen.

Posted in Real Estate News
Aug. 9, 2022

Laguna West Lakeside Neighborhood Housing Market Data for August 2022 ????

Elk Grove’s Laguna West Lakeside Neighborhood

.

Median Housing Market Data

.

Home prices are up 17% in the Laguna West Lakeside Neighborhood.  However, the prices are starting to drop it appears.  Last month home prices were up 25%.

.

Because we are looking at 6 months’ worth of home data, it will not show the housing market changing.  The month-to-month home data will show more housing market changes.  Please refer to my email for Elk Grove zip code 95758 to see the current housing market condition.

.

Looking at the numbers below, we had a very low inventory last year but more home sales.  More home buyers created the quickly rising housing prices.  Notice that there are far fewer home sales this year than last year.  I highlighted it in blue below.

.

For more housing information, visit my blog at https://www.allcahomes.com/blog/.

.

May Back 6 Months


Active Listings

List Price

Sale Price

DOM

Sold 2021

62

$508,500

$540,000

5

Sold 2022

49

$649,000

$665,000

7

June Back 6 Months


Active Listings

List Price

Sale Price

DOM

Sold 2021

61

$530,000

$580,000

5

Sold 2022

48

$689,500

$725,500

6

July Back 6 Months


Active Listings

List Price

Sale Price

DOM

Sold 2021

73

$535,000

$575,000

6

Sold 2022

48

$650,500

$675,000

7

.

I want to put you in the best possible position to get home at the best price.  I have a method to get you the best price possible on a home without over-biding.  Please feel free to give me a call, text, or email me to find out how my method works.
.

We can put a plan together to save you as much money as possible in these circumstances.  It is possible that waiting to buy or sell a home may help you have more fruit later.  Your family home is one of your most significant investments.  It's my job to ensure that it yields the highest ROI.  That means making smart decisions that will produce fruit in the future.  Planning is the best way to make this happen.

.


Posted in Real Estate News
Aug. 4, 2022

Elk Grove (95758) Housing Market Data for August 2022 ????????

Elk Grove Zip Code 95758 Housing Market Data for August 2022

.

Median Home Sales Data

.

Elk Grove housing prices are up 👆 8% in zip code 95758.  That is comparing July home sales this year to July last year.  Comparing May home sales this year to July, housing prices are down 👇 5%.

.

Let’s look at what the housing market numbers are telling us.  The DOM (days on market) is up (highlighted in blue below).  Homes are sitting on the market longer.  This is caused by more active listings (inventory), fewer home buyers, and time of the year.  I’ll get back to the time of year in a minute.

.

Active listings (inventory) have stayed natural most from last month.  This is highlighted in green below.  In June, the active listings went up.  July is about the same as June.

.

Now let’s talk about the time of year.  The time of year affects the housing market and the interest rate hikes.  Once the children go back to school, the housing market will usually cool off 💦🔥.  It can even take a big drop.

.

First, we'll look at the pending housing data.  Multiple offers play a big role in the housing market.  The multiple offers have dropped in the last few months.  In May, 69% had more than one offer.  In June, 47% and in July, 45% had more than one offer.

.

The homes that sold with more than one offer in May were 70%.  In June, 62% and July, 46%.  Last year in July, 76% of the homes that sold had more than one offer.  All these numbers show that the housing market is changing and cooling off.

.

**If you are buying a home, don’t overbid.  I expect homes will sell for less than the list price soon.  I have seen home buyers overpay for a home by 40k or more.  Be careful!

.

Major factors that go into buying a home that needs to be considered.  Are the expensive things such as the HAVC, roof, fencing, condition, and water heater?

.

For more housing information, visit my blog at https://www.allcahomes.com/blog/

.

May-22


# Listings

List Price

Sale Price

DOM

Active    52

50

$600,000

$0

19

Pending   54

54

$596,500

$0

9

Sold    61

56

$599,500

$625,000

7

Sold 2021

63

$499,000

$542,000

6

June-22


# Listings

List Price

Sale Price

DOM

Active

76

$599,919

$0

19

Pending

49

$589,900

$0

12

Sold

42

$599,475

$631,000

9

Sold 2021

66

$500,000

$547,500

6

July-22


# Listings

List Price

Sale Price

DOM

Active

75

$599,900

$0

25

Pending

40

$605,000

$0

15

Sold

46

$588,000

$592,500

13

Sold 2021

74

$519,000

$550,000

6

.

Average Housing Market Data

.

Using the average housing market data, Elk Grove prices are up 6% in the zip code of 95758.

.

Highlighted in blue below is the selling price each month.  Notice that prices have dropped in the last 3 months with this data.  Now, look at the original price and list price in the sold highlighted in green.  In June the price went up slightly while in July there was a significant drop.  This means more home sellers have had to drop their prices to sell their homes.

.

Also, compare the list price to the sold price each month.  In May, homes sold for about 20k over list price.  In June, about 15k over list price.  In July, only about 2k.

.

Many home buyers will make at least one of these mistakes when buying a home.  Don’t let that be you!!!

.

May-22


# Listings

Orig Price

List Price

Sale Price

DOM

Active

50

$646,270

$634,714

$0

29

Pending

54

$607,552

$608,948

$0

12

Sold

56

$650,749

$648,053

$668,114

12

Sold 2021

63

$512,093

$515,653

$556,143

13

June-22


# Listings

Orig Price

List Price

Sale Price

DOM

Active

76

$625,390

$612,836

$0

28

Pending

49

$620,720

$604,453

$0

19

Sold

42

$627,136

$628,319

$643,829

18

Sold 2021

66

$508,613

$512,773

$553,321

9

July-22


# Listings

Orig Price

List Price

Sale Price

DOM

Active

75

$627,023

$612,868

$0

33

Pending

40

$633,351

$608,368

$0

25

Sold

46

$624,048

$605,309

$607,407

19

Sold 2021

74

$537,391

$540,514

$572,552

10

.

This is comparing the last 6 months of home sales this year to the same time last year.

.

With the housing market changing, these numbers will not show as much as monthly.

.

While inventory is up, total sales are down.  Elk Grove housing prices are up 👆 16% in the zip code of 95758.

.

Elk Grove

Home Sales last 6 months


# of Sales

Median List Price

Median Sales Price

DOM

 Jun-21

308

$485,000

$520,000

6

 Jun-22

283

$599,000

$623,000

7

 Jul-21

340

$499,000

$535,000

6

 Jul-22

295

$598,000

$620,000

7

.

I want to put you in the best possible position to get a home at the best price.   I have a method to get you the best price possible on a home without over-biding.   Please feel free to give me a call, text, or email me to find out how my system works.

.


We can put a plan together to save you as much money as possible in these circumstances.   It is possible that waiting to buy or sell a home may help you have more fruit later.   Your family home is one of your most significant investments.   It's my job to ensure that it yields the highest ROI.   That means making smart decisions that will yield fruit in the future.   Planning is the best way to make this happen.

Posted in Real Estate News
Aug. 4, 2022

Carmichael Housing Market Data for August 2022 ???? ????

Carmichael Housing Market Data for August 2022

.

Median Housing Market Data

.

Carmichael housing prices are up 👆 10%.  This is comparing July home sales this year to July last year.  Home prices are down comparing May to July.

.

Let’s look at what the housing market numbers are telling us.  The DOM (days on market) is up (highlighted in blue below).  Homes are sitting on the market longer.  This is caused by more active listings (inventory), fewer home buyers, and time of the year.  I’ll get back to the time of year in a minute.

.

Active listings (inventory) have stayed natural for the most part from last month. 

.

Now let’s talk about the time of year.  The time of year affects the housing market and the interest rate hikes.  Once the children go back to school, the housing market will usually cool off 💦🔥.  It can even take a big drop.

.

Multiple offers are another area that would or could indicate a change in the housing market.  The changes should show first in the homes that are pending.  In May, 61% had more than one offer.  In June, 54% and July had 53%.  So it is trending down.  Not as fast as some other areas around Sacramento.

.

Of the homes that sold with multiple offers, May was at 75%.  June had 60%, and July had 50% with more than one offer.  Last year in July, 59% had more than one offer.

.

**If you are buying a home, don’t overbid.  I expect homes will sell for less than the list price soon.  I have seen home buyers overpay for a home by 40k or more.  Be careful!

.

Major factors that go into buying a home that needs to be considered.  Are the expensive things such as the HAVC, roof, fencing, condition, and water heater?

.

For more housing information, visit my blog at https://www.allcahomes.com/blog/

.

May-22


# Listings

List Price

Sale Price

DOM

Active  72

70

$633,000

$0

14

Pending   78

71

$575,000

$0

8

Sold   56

47

$599,900

$625,000

9

Sold 2021

78

$500,000

$530,000

6

June-22


# Listings

List Price

Sale Price

DOM

Active

90

$622,000

$0

21

Pending

57

$619,000

$0

10

Sold

73

$549,000

$560,000

8

Sold 2021

93

$512,500

$539,000

7

July-22


# Listings

List Price

Sale Price

DOM

Active

86

$630,000

$0

31

Pending

49

$550,000

$0

20

Sold

48

$618,500

$620,000

10

Sold 2021

82

$534,500

$565,150

8

.

Average Housing Market Data

.

Using the average housing market data, Carmichael home prices are up 👆 11%.

.

Highlighted in blue below are the active listings. Some home sellers have had to drop prices to sell their homes. This is never a good sign for the home seller. Once you have been on the market past 14 days and it’s still not pending.

.

Market conditions dictate what strategy to use when selling a home. In most cases, the longer the home is on the market, the less the seller will get for the home. Price drops are rarely good for the home seller.

.

The homes that sold in July are in red below there is not as large a gap between the original price and the list price. Also, the DOM is much lower, meaning it sold within 14 days in most cases. Home sellers did a much better job pricing their homes.

.

It’s hard to understand, but the home buyer controls the price of a home, not the seller.

.

Many home buyers will make at least one of these mistakes when buying a home. Don’t let that be you!!!

.

May-22


# Listings

Orig Price

List Price

Sale Price

DOM

Active

70

$781,472

$763,279

$0

28

Pending

71

$662,226

$651,275

$0

13

Sold

47

$675,315

$660,066

$680,777

15

Sold 2021

78

$634,047

$628,130

$642,819

16

June-22


# Listings

Orig Price

List Price

Sale Price

DOM

Active

90

$743,287

$721,870

$0

32

Pending

57

$670,219

$654,242

$0

17

Sold

73

$637,663

$632,583

$645,389

12

Sold 2021

93

$592,469

$590,168

$611,208

15

July-22


# Listings

Orig Price

List Price

Sale Price

DOM

Active

86

$774,560

$745,970

$0

42

Pending

49

$610,415

$590,404

$0

26

Sold

48

$668,144

$652,475

$660,868

17

Sold 2021

82

$584,871

$580,116

$595,269

15

.

When comparing the last 6 months of home sales this year to the same time last year.

.

With the housing market changing, these numbers will not show as much as monthly.

.

Carmichael housing prices are up 👆 10%.  The number that stands out is the number of home sales.  They are down from last year.  Total home sales have dropped drastically.  This tells us there are fewer home buyers currently shopping. 

.

Carmichael

Home Sales last 6 months


# of Sales

Median List Price

Median Sales Price

DOM

 Jun-21

408

$489,900

$512,500

6

 Jun-22

360

$536,500

$548,500

7

 Jul-21

419

$515,900

$540,000

7

 Jul-22

316

$589,000

$595,000

8

.

I want to put you in the best possible position to get a home at the best price.  I have a method to get you the best price possible on a home without over-biding. Please feel free to give me a call, text, or email me to find out how my system works.
.

We can put a plan together to save you as much money as possible in these circumstances. It is possible that waiting to buy or sell a home may help you have more fruit later. Your family home is one of your largest investments. It's my job to ensure that it yields the highest ROI. That means making smart decisions that will yield fruit in the future. Planning is the best way to make this happen.



Posted in Real Estate News
Aug. 3, 2022

Roseville’s Housing Market Conditions for August 2022

Roseville’s Housing Market Conditions for August 2022

.

Median Housing Market Data

.

Roseville home prices are up 👆 13%.  This is comparing July this year to July last year.  Home prices are down 👇 2% Comparing May 2022 to July 2022.

.

The housing market data shows a housing market change.  The housing market is continuing to slow down 💦🔥.

.

The DOM (days on market) continues to rise (highlighted in blue below).  I expect this to continue.

.

The active listings (inventory) also continue to rise (highlighted in bright yellow).  This I also expect to continue until October.

.

In red below are the homes that sold.  The number drops off in July quite a bit.  This is normal in a normal housing market.  Normally when the children go back to school, the housing market drops.  Notice the number of home sales last year in July compared to this year.  A large drop-off.

.

As the housing market is changing, the home sellers seem to be listing their homes for less (highlighted in green).  This is a good thing.

.

Looking at the multiple offers.  The pending will be the first to show a housing market change.  In May, the pending had 👇 44% with more than one offer.  In June, that dropped to 👇 37%, and in July, it dropped even more, 👇 25%.  I believe that this will continue to drop.

.

**If you are buying a home, don’t overbid.  I expect homes will sell for less than the list price soon.  I have seen home buyers overpay for a home by 40k or more.  Be careful!

.

Major factors that go into buying a home that needs to be considered are the expensive things.  Such as the HAVC, roof, fencing, condition, and water heater.

.

Of the homes that sold in May 👇 68% had more than one offer.  In June, it dropped to 👇 50%, and in July, it dropped to 👇 38%.  Last year in July 72% had more than one offer.

.

For more housing information, visit my blog at https://www.allcahomes.com/blog/

.

May-22


# Listings

List Price

Sale Price

DOM

Active

235

$729,000

$0

20

Pending   236

228

$689,387

$0

10

Sold   195

190

$674,950

$699,500

6

Sold 2021

224

$599,999

$650,000

5

June-22


# Listings

List Price

Sale Price

DOM

Active

341

$689,000

$0

22

Pending

192

$694,628

$0

13

Sold

191

$685,000

$680,000

10

Sold 2021

232

$599,900

$639,000

5

July-22


# Listings

List Price

Sale Price

DOM

Active

390

$672,450

$0

29

Pending

185

$659,990

$0

18

Sold

157

$675,000

$687,034

14

Sold 2021

234

$595,000

$609,000

6

.

Average housing Market Data

.

Using the average housing market data, Roseville home prices are up 👆 11%.  This is comparing July this year to July last year.

.

Looking at July numbers.  The homes that sold are starting to see changes as well now.  Highlighted in green below, notice the drop from the original price to the list price.  Also, the sale price is now lower than the list price.

.

I believe this will continue.

.

Many home buyers will make at least one of these mistakes when buying a home.  Don’t let that be you!!!

.

May-22


# Listings

Orig Price

List Price

Sale Price

DOM

Active

235

$812,529

$801,487

$0

28

Pending

228

$705,978

$702,240

$0

16

Sold

190

$731,225

$722,535

$746,288

11

Sold 2021

224

$641,885

$644,307

$676,445

8

June-22


# Listings

Orig Price

List Price

Sale Price

DOM

Active

341

$777,814

$760,840

$0

30

Pending

192

$745,396

$730,453

$0

22

Sold

191

$693,407

$687,703

$693,019

14

Sold 2021

232

$616,439

$617,511

$651,358

7

July-22


# Listings

Orig Price

List Price

Sale Price

DOM

Active

390

$744,571

$724,315

$0

38

Pending

185

$711,268

$695,834

$0

26

   Sold

157

$736,146

$718,606

$717,917

22

Sold 2021

234

$621,740

$621,058

$645,932

10

.

When comparing the last 6 months of home sales this year to the same time last year.

.

With the housing market changing, these numbers will not show as much as monthly.

.

Roseville housing prices are up 👆 11%.  The number that stands out is the number of home sales.  They are down from last year. 

.

Roseville

Home Sales last 6 months


# of Sales

Median List Price

Median Sales Price

DOM

 Jun-21

1142

$575,000

$600,500

5

 Jun-22

1081

$650,000

$673,326

6

 Jul-21

1251

$585,000

$610,000

5

 Jul-22

1121

$659,900

$675,000

7

.

I want to put you in the best possible position to get home at the best price.  I have a method to get you the best price possible on a home without over-biding.  Please feel free to give me a call, text, or email me to find out how my method works.
.


We can put a plan together to save you as much money as possible in these circumstances.  It is possible that waiting to buy or sell a home may help you have more fruit later.  Your family home is one of your most significant investments.  It's my job to ensure that it yields the highest ROI.  That means making smart decisions that will produce fruit in the future.  Planning is the best way to make this happen.

Posted in Real Estate News
July 22, 2022

Antelope Housing Market Sales Data as of July 2022 ????????

Antelope Housing Market Data for June 2022

.

Median Housing Market Data

.

Antelope housing prices are up 👆 12% when comparing June home sales this year to June last year.  All the signs are pointing to a softening housing market.  This housing market is cooling off 💦🔥.

.

Now, look at what is happening in the housing market.  Remember, we are in the prime housing market season.  Most of the changes in the housing market will appear first in the active listings and pending within the current month.

.

Some key housing market data are active listings (inventory), DOM (days on market), and multiple offers.  First, let's look at active inventory.  This is highlighted in green below.  It has continued to increase, which is normal this time of year.  When fewer homes sell, inventory will increase as well.

.

Another sign of a softening housing market is the DOM.  This is highlighted in blue below.  Notice the increase each month.  I would expect this to continue to increase as we move forward.

.

When looking at Multiple offers over the last 3 months, it also has signs of a slowing housing market.  Looking first at the homes that were pending each month.  In April, 81% had more than one offer.  May dropped to 56% and June to 46%.

.

June home sales also show a sign of a declining housing market.  The sales price is less than the list price.  Meaning more homes are selling below list price.

.

The housing market has changed, and it’s important to stay ahead.  If you are selling, DON’T GET TOO AGGRESSIVE.  If you are buying a home, DON’T OVERBID.

.

Want to get top dollar for your home if you are selling.  Check out my home selling checklist with valuable tips and information.  Home Selling Checklist

.

If you are thinking about moving to a bigger or smaller home but you are worried about having to move twice.  I have a method put in place, so you only have to move once.  Downsizing my Home - Need a Bigger Home

.

If you are thinking about selling, right now is the time.  If you want top dollar!  Here is a helpful list of do’s and don’t when selling a home.

.

For more housing information, visit my blog at https://www.allcahomes.com/blog/


.

April-22


# Listings

List Price

Sale Price

DOM

Active

38

$539,450

$0

11

Pending

52

$532,450

$0

7

Sold

59

$499,000

$520,000

6

Sold 2021

73

$435,000

$455,000

6

May-22


# Listings

List Price

Sale Price

DOM

Active    40

36

$534,450

$0

12

Pending   62

57

$539,000

$0

7

Sold

43

$535,000

$560,000

7

Sold 2021

60

$470,950

$496,000

6

June-22


# Listings

List Price

Sale Price

DOM

Active

57

$529,900

$0

18

Pending

33

$506,125

$0

15

Sold

55

$529,000

$525,000

7

Sold 2021

48

$449,000

$468,500

5

.

Average Housing Market Data

.

Antelope housing prices are up 13%.  This is comparing June home sales this year to June last year.

.

Other numbers show signs of a weakening housing market.  Looking at the original price compared to the list price below.  Highlighted in blue below are some key numbers.  The gap between the original price and the list price is widening.  This indicates more home sellers have to drop their prices to get the sold.  It also indicates that more home sellers are pricing their homes too high when listing.

.

Looking at the homes that sold that last couple of months highlighted in green below.  The gap between the original price and the list price is much closer.  A very important number to look at when selling a home.

.

Many home buyers will make at least one of these mistakes when buying a home.  Don’t let that be you!!!

.

May-22


# Listings

Orig Price

List Price

Sale Price

DOM

Active

36

$559,250

$551,139

$0

25

Pending

57

$544,463

$539,725

$0

11

Sold

43

$540,440

$538,604

$559,632

10

Sold 2021

60

$478,395

$481,579

$503,677

8

June-22


# Listings

Orig Price

List Price

Sale Price

DOM

Active

57

$546,456

$534,758

$0

29

Pending

33

$541,118

$533,591

$0

15

Sold

55

$537,260

$533,349

$541,019

11

Sold 2021

48

$447,886

$449,293

$474,760

6

.

When comparing the last 6 months of home sales this year to the same time last, Antelope housing prices are up 17%.

.

When taking 6 months of housing data, any change in the housing market will not show up as fast.

.

The month-to-month housing market data will show any changes much quicker.

.


Antelope

Home Sales last 6 months


# of Sales

Median List Price

Median Sales Price

DOM

 May-21

317

$435,000

$450,000

6

 May-22

267

$514,900

$530,000

7

 Jun-21

305

$439,900

$460,000

5

 Jun-22

274

$515,500

$536,323

7

Posted in Real Estate News
July 15, 2022

Rocklin Housing Market Data for July 2022

Rocklin Housing Market Data for July 2022  💦🔥💦🏡


Median Housing Market Data

.

Rocklin home prices are up 👆 3%.  This is comparing June home sales this year to June last year.  However, the housing market has changed.  It’s cooling off 💦🔥💦🏡.

.

Now, look at what is happening in the housing market.  Remember, we are in the prime housing market season.  Any changes in the housing market will appear first in the active listings and pending within the current month.

.

Some key housing market data are active listings (inventory), DOM (days on market), and multiple offers.  First, let's look at active inventory.  The active listings are going up, which is normal this time of year.  This is highlighted in green below.

.

The DOM (days on market) is going up.  This is a sign of a housing market that is changing.  This is highlighted in blue below.  In April, housing only sat on the market for 5 days.  In May and June, that number tripled.

.

Comparing the multiple offers of the pending homes from month to month.  In April, the homes in Rocklin had 55% with more than one offer.  In May, it dropped to 49%.  Now in June, it dropped to 34%.  This is also a sign of a housing market that has changed.

.

Looking at the homes that sold in the last 3 months.  Of the homes that sold going from April to June.  72%, 61%, and 56% had more than one offer.  Last year at this same time, the numbers were 75%, 71%, and 65%.  These numbers are trending down, indicating a changing housing market.

.

Another indicator is prices are not going up as fast.  In April, Rocklin had a 17% increase in housing prices from the same time last year.  In May that number dropped to 9% and in June to 3%.

.

The housing market has changed, and it’s important to stay ahead.  If you are selling, DON’T GET TOO AGGRESSIVE.  If you are buying a home, DON’T OVERBID.

.

Want to get top dollar for your home if you are selling.  Check out my home selling checklist with valuable tips and information.  Home Selling Checklist

.

If you are thinking about moving to a bigger or smaller home but you are worried about having to move twice.  I have a method put in place, so you only have to move once.  Downsizing my Home - Need a Bigger Home

.

If you are thinking about selling, right now is the time.  If you want top dollar!  Here is a helpful list of do’s and don’t when selling a home.

.

If you are thinking about selling, right now is the time.  If you want top dollar!  Yes, listing your home SUCKS!  Here is a helpful list of do’s and don’t when selling a home.

.

If you are thinking about moving to a bigger or smaller home but you are worried about having to move twice.  I have a method put in place, so you only have to move once.

.

For more housing information, visit my blog at https://www.allcahomes.com/blog/

.

April-22


# Listings

List Price

Sale Price

DOM

Active

69

$740,000

$0

5

Pending

97

$709,950

$0

7

Sold

92

$694,500

$727,500

6

Sold 2021

104

$599,000

$623,500

5

May-22


# Listings

List Price

Sale Price

DOM

Active    70

68

$747,450

$0

16

Pending   100

92

$729,950

$0

7

Sold    78

72

$729,888

$761,000

6

Sold 2021    131

119

$669,000

$700,000

6

June-22


# Listings

List Price

Sale Price

DOM

Active

112

$739,500

$0

15

Pending

67

$749,500

$0

12

Sold

82

$705,000

$735,000

7

Sold 2021

124

$664,500

$715,000

6

.

Average Housing Market Data

.

Looking at the Average housing market data.  Highlighted in blue below.  The difference between the original price and the list price has increased.  This means that more home sellers have to drop their prices to get the home sold.

.

If you price your home correctly, it will sell faster.  Looking at the DOM and comparing the sold to the active.  The sold DOM is much quicker, indicating they priced their home right.

.

Many home buyers will make at least one of these mistakes when buying a home.  Don’t let that be you!!!

.

April-22


# Listings

Orig Price

List Price

Sale Price

DOM

Active

69

$823,678

$818,938

$0

16

Pending

97

$755,542

$750,496

$0

14

Sold

92

$755,659

$751,858

$780,560

12

Sold 2021

104

$630,964

$635,468

$666,581

9

May-22


# Listings

Orig Price

List Price

Sale Price

DOM

Active

68

$873,901

$861,161

$0

23

Pending

92

$762,789

$752,729

$0

14

Sold

72

$835,117

$831,661

$865,727

10

Sold 2021

119

$714,725

$715,150

$745,004

8

June-22


# Listings

Orig Price

List Price

Sale Price

DOM

Active

112

$857,191

$843,174

$0

23

Pending

67

$841,119

$827,805

$0

20

Sold

82

$758,631

$747,150

$755,430

13

Sold 2021

124

$738,361

$741,779

$775,136

12

.

When comparing the last 6 months of home sales this year to the same time last year, Rocklin’s home prices are up 16%.  

.

These numbers will be the last place that will show the change in the housing market.

.

Rocklin

Home Sales last 6 months


# of Sales

Median List Price

Median Sale Price

DOM

 May-21

541

$595,000

$610,000

6

 May-22

454

$699,000

$725,000

7

 Jun-21

559

$610,000

$635,000

6

 Jun-22

467

$700,000

$735,000

7

.

I want to put you in the best possible position to get a home at the best price.  I have a method put in place to get you the best price possible on a home without over-biding.  Please feel free to give me a call, text, or email me to find out how my system works.
.


We can put a plan together to save you as much money as possible in these circumstances.  It is possible that waiting to buy or sell a home may help you have more fruit later.  Your family home is one of your largest investments.  It's my job to ensure that it yields the highest ROI.  That means making smart decisions that will yield fruit in the future.  Planning is the best way to make this happen.
Posted in Real Estate News
July 7, 2022

Carmichael Housing Market Data for July 2022 ????????

Carmichael Housing Market Data for July 2022

.

Median Housing Market Data

.

Carmichael housing prices are up 👆 4%. This is comparing June home sales this year to June last year. In the last 3 months, the home prices have jumped around some. Comparing April home sales this year to June home prices a down in Carmichael. This housing market is cooling off 💦🔥.

.

Now, look at what is happening in the housing market. Remember we are in the prime housing market season. Any changes in the housing market will appear first in the active listings and pending within the current month.

.

Some of the key housing market data are active listings (inventory), DOM (days on market), and multiple offers. First, let's look at active inventory. This is highlighted in green below. It has continued to increase which is normal this time of year. But can also be happening with fewer homes selling.

.

Now, look at the DOM. This is highlighted in blue below. The DOM has increased. This can be normal as well with more active listings. And fewer homebuyers. The DOM started to increase when interest rates began to climb. With the increased interest rates many homebuyers can’t afford the monthly payments now. The homebuyers are either not looking anymore or looking at lower-priced homes.

.

The multiple offers give us more information. In April the pending homes had 67% with more than one offer. In May that number decreased to 61%. In June they decreased more down to 54%.

.

The housing market has changed and it’s important to stay ahead. If you are selling DON’T GET TOO AGGRESSIVE. If you are buying a home DON’T OVERBID.

.

Want to get top dollar for your home if you are selling. Check out my home selling checklist with valuable tips and information. Home Selling Checklist

.

If you are thinking about moving to a bigger or smaller home but you are worried about having to move twice. I have a method put in place, so you only have to move once. Downsizing my Home - Need a Bigger Home

.

If you are thinking about selling, right now is the time. If you want top dollar! Here is a helpful list of do’s and don’t when selling a home.

.

If you are thinking about selling, right now is the time. If you want top dollar! Yes, listing your home SUCKS! Here is a helpful list of do’s and don’t when selling a home.

.

If you are thinking about moving to a bigger or smaller home but you are worried about having to move twice. I have a method put in place, so you only have to move once.

.

For more housing information, visit my blog at https://www.allcahomes.com/blog/

.

April-22


# Listings

List Price

Sale Price

DOM

Active

53

$599,000

$0

9

Pending

61

$595,000

$0

7

Sold

65

$549,900

$576,000

6

Sold 2021

79

$499,000

$510,000

6

May-22


# Listings

List Price

Sale Price

DOM

Active 

70

$633,000

$0

14

Pending

71

$575,000

$0

8

Sold 

47

$599,900

$625,000

9

Sold 2021

78

$500,000

$530,000

6

June-22


# Listings

List Price

Sale Price

DOM

Active

90

$622,000

$0

21

Pending

57

$619,000

$0

10

Sold

73

$549,000

$560,000

8

Sold 2021

93

$512,500

$539,000

7


.

Average Housing Market Data

.

Carmichael housing prices are up 6% using the average housing market data. Again, this is comparing June home sales this year to June last year.

.

Let’s look at the housing market data that shows some home sellers are not pricing their homes correctly. And how it’s currently hurting them. Looking at the housing market data below.

.

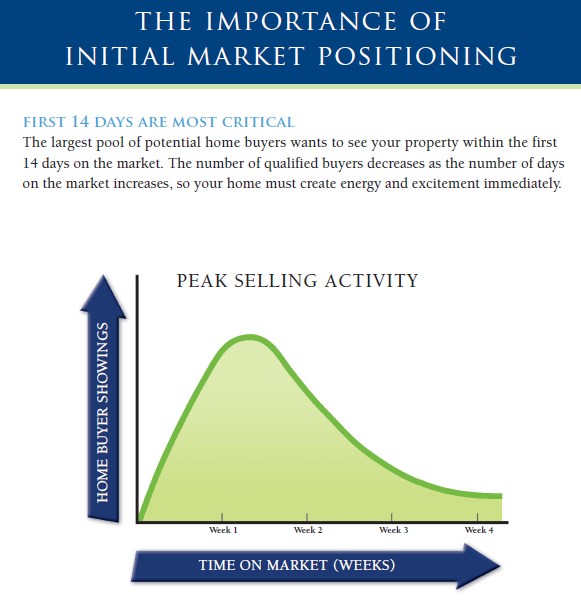
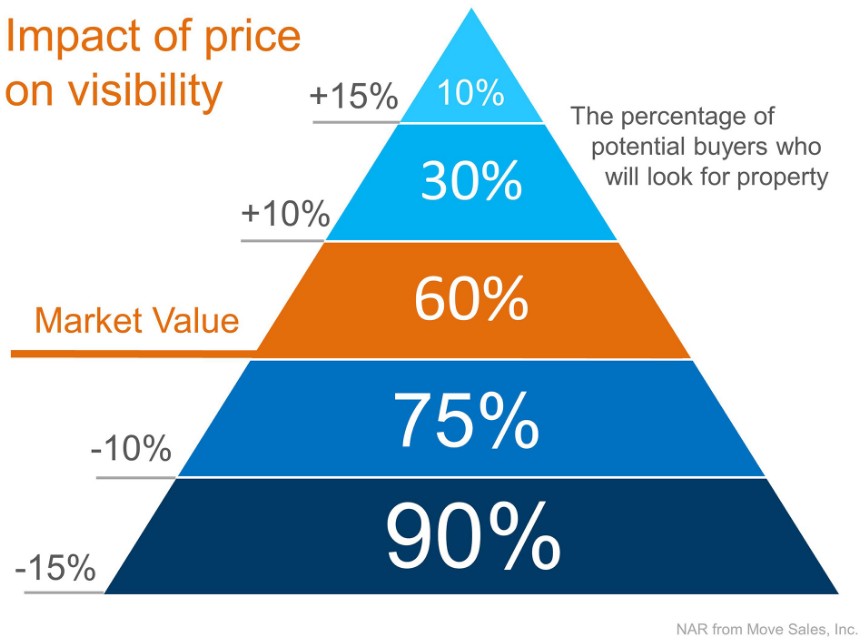
The most attention your home will receive is in the first 14 days (See Chart B). If you overprice your home the homebuyers will not look or even see your home (Chart A). You are also letting homebuyers know that they can haggle you more. Why? Because they now not that many homebuyers are looking at your home.

.

Of the homes that have sold over the last few months (highlighted in green below). Notice the difference between the original price and the list price. The original price is when the home first comes on the market. The list price is the price when it went under contract. In May it appears that some home sellers dropped their prices more than in June.

.

Now, look at the active listings. Notice the difference in the original price and list price. A much larger gap between them. Also, notice the selling price compared to the active price. The selling price is much lower.

.

Also, look at the DOM of the homes that sold compared to the active listings. Big difference.

.

Here are a couple of charts that show the importance of correct pricing.

.

Chart A


.

Chart B


.

Many home buyers will make at least one of these mistakes when buying a home. Don’t let that be you!!!

.

May-22


# Listings

Orig Price

List Price

Sale Price

DOM

Active

70

$781,472

$763,279

$0

28

Pending

71

$662,226

$651,275

$0

13

Sold

47

$675,315

$660,066

$680,777

15

Sold 2021

78

$634,047

$628,130

$642,819

16

June-22


# Listings

Orig Price

List Price

Sale Price

DOM

Active

90

$743,287

$721,870

$0

32

Pending

57

$670,219

$654,242

$0

17

Sold

73

$637,663

$632,583

$645,389

12

Sold 2021

93

$592,469

$590,168

$611,208

15

.

This housing market data is comparing the last 6 months of home sales this year to the same time last year.  Changes in the housing market don’t show up in the housing data. 

.

Housing prices are up 7% in Carmichael. 

.


Carmichael

Home Sales last 6 months


# of Sales

Median List Price

Median Sales Price

DOM

 May-21

369

$495,000

$510,500

6

 May-22

313

$542,000

$561,000

7

 Jun-21

408

$489,900

$512,500

6

 Jun-22

360

$536,500

$548,500

7

Posted in Real Estate News