Jan. 25, 2022

Fair Oaks Housing Market Data for December 2021

Fair Oaks Housing Market Data for December 2021


Median Housing Market   Data


In Fair Oaks, it is hard to look at the housing market data. The reason, is there are some million-dollar homes that sell which throw off the housing market numbers.

Looking at the housing data below. In blue each month there are fewer active listings. This is normal as the holidays get closer.


Looking at the last 4 months of home sales (in red). The selling price continues to increase. From September to December the home prices increased 9%.

The list price is lower than the sale price each month. Indicating multiple offers. September had 61% with more than one offer. 60%, 64%, and December had 66% of offers received more than one offer.


Last year 64%, 63%, 61% and 55% from September to December.


When comparing December home sales this year compared to December last year. Fair Oaks home prices are up 13%.

When comparing home sales from September to December this year. Home prices are up 9%. Again, this can be thrown off by higher-priced homes selling.


September-21


# Listings

List Price

Sale Price

DOM

Active

46

$675,000

$0

28

Pending

71

$560,000

$0

13

Sold

72

$532,000

$535,000

8

Sold 2020

70

$532,450

$532,000

8

 October-21


# Listings

List Price

Sale Price

DOM

Active

47

$620,000

$0

13

Pending

61

$545,000

$0

8

Sold

62

$599,500

$612,500

13

Sold 2020

82

$472,450

$477,500

7

 November-21


# Listings

List Price

Sale Price

DOM

Active

26

$597,500

$0

33

Pending

56

$545,000

$0

8

Sold

55

$529,900

$550,000

8

Sold 2020

75

$500,000

$525,000

7

 December-21


# Listings

List Price

Sale Price

DOM

Active

22

$597,500

$0

21

Pending

41

$575,000

$0

10

Sold

55

$575,000

$585,000

8

Sold 2020

62

$499,700

$518,500

6


Below is a list of all 55 homes that sold in December. The list is sorted by the percentage below list price to the highest above list price.

Of the 12 homes that sold below list price. They averaged 30 plus days on the market. Many of them had to do a price drop. Most important notice that many got even less for their home.


It’s so important to price your home correctly. DON’T go By Zillow Estimate!!! That’s why they call it ESTIMATE. Zillow can be off as much as 40%.

Of the 29 homes that sold for the above list price. They were only on the market for just above 10 days. Only 2 had to drop their price.

To the right of the blue line are the amounts the sellers had to drop or increase their price.


Status

Original Price

List Price

Sold Price

DOM


Percent Above or Below List Price


Price drops/ Increases

Closed

225000

225000

205000

65


-9%


0

Closed

415000

395000

365000

6


-8%


-20000

Closed

1262000

975000

910000

39


-7%


-287000

Closed

649900

649900

626000

31


-4%


0

Closed

690000

674500

650000

34


-4%


-15500

Closed

929900

929900

900000

6


-3%


0

Closed

1250000

1250000

1210000

50


-3%


0

Closed

540000

540000

525000

63


-3%


0

Closed

615000

615000

600000

14


-2%


0

Closed

439900

434900

426200

15


-2%


-5000

Closed

550000

550000

545000

8


-1%


0

Closed

699000

699000

695000

34


-1%


0

Closed

499000

499000

497020

5


0%


0

Closed

787000

739900

739900

60


0%


-47100

Closed

699000

699000

699000

25


0%


0

Closed

449000

449888

449888

18


0%


888

Closed

995000

995000

995000

7


0%


0

Closed

750000

750000

750000

14


0%


0

Closed

690000

670000

670000

21


0%


-20000

Closed

235000

235000

235000

5


0%


0

Closed

694000

694000

694000

7


0%


0

Closed

825000

799950

800000

21


0%


-25050

Closed

760900

714900

715000

48


0%


-46000

Closed

649000

649000

650000

8


0%


0

Closed

499000

499000

500000

43


0%


0

Closed

549000

528000

530000

21


0%


-21000

Closed

560000

545000

550000

13


1%


-15000

Closed

750000

750000

757000

5


1%


0

Closed

619000

619000

625000

40


1%


0

Closed

510000

499900

505000

8


1%


-10100

Closed

865000

865000

875000

40


1%


0

Closed

849000

849000

860000

5


1%


0

Closed

429000

429000

435000

18


1%


0

Closed

349900

349900

354900

6


1%


0

Closed

575000

575000

585000

12


2%


0

Closed

774900

774900

790000

4


2%


0

Closed

475000

475000

485500

8


2%


0

Closed

540000

540000

554000

28


3%


0

Closed

855000

855000

880000

18


3%


0

Closed

290000

290000

300000

8


3%


0

Closed

525000

525000

545000

0


4%


0

Closed

519900

519900

540000

3


4%


0

Closed

315000

315000

330000

9


5%


0

Closed

675000

675000

715000

4


6%


0

Closed

879000

879000

935000

3


6%


0

Closed

949000

949000

1010000

6


6%


0

Closed

599000

599000

640000

7


7%


0

Closed

399900

399900

430000

17


8%


0

Closed

410000

410000

445000

6


9%


0

Closed

529000

529000

575000

7


9%


0

Closed

525000

525000

575000

7


10%


0

Closed

465000

465000

516500

2


11%


0

Closed

519000

519000

580000

6


12%


0

Closed

470000

470000

535500

5


14%


0

Closed

999000

999000

1225000

5


23%


0


Average Housing Market Data


Looking at the numbers below. In red below notice the original price compared to the list price. Notice how the numbers are close.

Now, look at the active listings in blue. Notice the larger gap between the original price and the list price. This is because more home sellers are having to drop their prices.


Also, look at the DOM (days on market). Look how much higher they are in the active listings.

Therefore, it’s so important to list your home correctly when you decide to sell.


September-21


# Listings

Orig Price

List Price

Sale Price

DOM

Active

46

$766,989

$741,926

$0

38

Pending

71

$642,214

$639,957

$0

20

Sold

72

$592,947

$587,674

$595,060

15

Sold 2020

70

$551,991

$545,234

$548,282

21

October-21


# Listings

Orig Price

List Price

Sale Price

DOM

Active

47

$709,413

$687,436

$0

31

Pending

61

$633,201

$619,161

$0

22

Sold

62

$630,821

$627,713

$636,098

21

Sold 2020

82

$518,924

$514,656

$518,901

18

November-21


# Listings

Orig Price

List Price

Sale Price

DOM

Active

26

$755,185

$716,142

$0

51

Pending

56

$617,955

$605,765

$0

18

Sold

55

$593,589

$584,322

$592,528

23

Sold 2020

75

$565,450

$562,002

$568,004

17

December-21


# Listings

Orig Price

List Price

Sale Price

DOM

Active

22

$708,984

$689,532

$0

47

Pending

41

$636,094

$614,999

$0

24

Sold

55

$618,967

$619,206

$631,553

18

Sold 2020

62

$544,679

$539,289

$544,632

18


When comparing the last 6 months of homes sales this year to the same time last year. In the red notice that home prices are falling. Home prices dropped almost 2% during those 4 months.


Last year notice that home prices increased during the same time.

The number of sales (in blue) this year has dropped compared to last year.

In green are last year's sales. Notice the increase each month.


Fair Oaks, CA

Home Sales last 6 months


Number of Sales

Median List Price

Median Sales Price

DOM

 Sep 20

365

$485,000

$480,000

10

 Sep 21

411

$565,000

$589,000

7

 Oct 20

409

$475,000

$480,000

10

 Oct 21

417

$575,000

$600,000

8

 Nov 20

445

$495,000

$499,000

9

 Nov 21

399

$575,000

$590,000

8

 Dec 20

447

$499,000

$503,000

8

 Dec 21

384

$569,495

$580,000

8

Posted in Real Estate News
Jan. 25, 2022

Elk Grove’s Laguna West Lakeside Neighborhood for December 2021

Elk Grove’s Laguna West Lakeside Neighborhood

.

Median Housing Market Data

.

When comparing the last 6 months of home sales this year to the same time last year.  In red, the sales price has been the same. 

.

Looking at the blue.  Home sellers have increased the listing price each month.

Home 🏡 prices have just not gone up ☝🏻

.


September Back 6 Months


Active Listings

List Price

Sale Price

DOM

Sold 2020

102

$482,450

$492,500

7

Sold 2021

85

$574,000

$610,000

7

October Back 6 Months


Active Listings

List Price

Sale Price

DOM

Sold 2020

102

$482,450

$492,500

7

Sold 2021

85

$574,000

$610,000

7

November Back 6 Months


Active Listings

List Price

Sale Price

DOM

Sold 2020

105

$489,000

$496,000

7

Sold 2021

88

$579,450

$610,000

7

December Back 6 Months


Active Listings

List Price

Sale Price

DOM

Sold 2020

103

$489,000

$495,000

6

Sold 2021

80

$594,450

$610,000

8

Posted in Real Estate News
Jan. 19, 2022

Elk Grove Housing Market Data for zip code 95758 December 2021

Elk Grove Zip Code 95758 Housing Market Data for December 2021

.

Median Home Sales Data

.

Looking at the median housing 🏡 market data. Looking at the sales price in December in red 🟥. Notice how much above the sales price as compared to the list price in September. Looking down at the other months’ notice how the gap shrinks.

.

Notice the active listings in blue 🟦. Look at how the drop from September to December. This is normal during this time of year.

.

Looking at the multiple offers in the zip code. Of the homes pending during each month. September had 60%, 56%, 66% and 69%.
.

Looking at the sold homes and how many had multiple offers. September had 62%, 68%, 62% and 66%. These numbers are high compared to other parts of Sacramento.
.

Looking back at December's multiple offers of last year. 73%, 78%, 83% and 84%. Last year the housing market was a little hotter 🔥.

.

Of the 50 homes that sold in December.  8 sold for under-list price.  8 sold for list price.  34 sold for over list price.  There is a way as an agent you can tell or have an idea where a home may sell.  You should never pay more unless you have to. 

.

September-21


Active Listings

List Price

Sale Price

DOM

Active

28

$599,000

$0

9

Pending

93

$545,000

$0

8

Sold

79

$529,900

$560,000

8

Sold 2020

82

$442,000

$458,000

6

 October-21


Active Listings

List Price

Sale Price

DOM

Active

33

$575,000

$0

16

Pending

86

$552,500

$0

7

Sold

77

$538,000

$560,000

8

Sold 2020

80

$434,450

$450,000

5

 November-21


Active Listings

List Price

Sale Price

DOM

Active

16

$629,900

$0

41

Pending

61

$550,000

$0

8

Sold

66

$560,000

$570,000

7

Sold 2020

80

$440,000

$460,250

7

December-21


Active Listings

List Price

Sale Price

DOM

Active

13

$599,000

$0

11

Pending

42

$575,000

$0

6

Sold

50

$572,000

$580,000

7

Sold 2020

80

$454,894

$460,000

6

.

Average Housing Market Data

.

Comparing the original price to the list price. In Red 🔴 the number stays pretty close to each other. This indicates not many home 🏡 sellers have had to drop their prices.

.

Going the active listings in Blue 🔵. This gap is a little bigger than the sold homes. Which is normal. This area however is much closer than other areas of Sacramento.
.

Highlighted in green 🟢. The DOM and number of listings. With only 13 active listings the DOM can be off.

.

September-21


# Listings

Orig Price

List Price

Sale Price

DOM

Active

28

$667,623

$662,838

$0

15

Pending

93

$573,609

$568,541

$0

16

Sold

79

$571,390

$570,388

$584,207

11

Sold 2020

82

$458,500

$458,151

$469,000

13

October-21


# Listings

Orig Price

List Price

Sale Price

DOM

Active

33

$618,616

$613,474

$0

23

Pending

86

$586,537

$585,603

$0

13

Sold

77

$563,365

$559,334

$573,978

16

Sold 2020

80

$451,599

$450,458

$461,839

10

November-21


# Listings

Orig Price

List Price

Sale Price

DOM

Active

16

$673,137

$663,481

$0

42

Pending

61

$584,730

$582,614

$0

15

Sold

66

$574,028

$578,624

$596,271

10

Sold 2020

80

$467,754

$467,277

$480,773

16

December-21


# Listings

Orig Price

List Price

Sale Price

DOM

Active

13

$612,615

$612,054

$0

35

Pending

42

$595,247

$590,254

$0

12

Sold

50

$583,360

$583,241

$597,131

13

Sold 2020

80

$464,730

$465,746

$479,057

9

.

Comparing the last 6 months of home sales this year to the same time last year.  That would be from July 1st to December 31st.  In red 🔺 notice the difference between the list price and the sales price. 

.

Now, look at last year’s numbers in blue 🔷.  Notice the numbers are much closer.  This indicates that the housing market this year is much hotter 🔥.

.

Home Sales last 6 months


Number of Sales

Median List Price

Median Sales Price

DOM

 Sep 20

423

$420,000

$425,000

8

 Sep 21

422

$509,950

$546,750

6

 Oct 20

460

$425,000

$430,000

7

 Oct 21

457

$519,000

$550,000

7

 Nov 20

485

$429,900

$438,000

7

 Nov 21

460

$529,000

$555,000

7

 Dec 20

505

$432,000

$442,000

6

 Dec 21

443

$534,200

$560,000

7

 .

Posted in Real Estate News
Jan. 19, 2022

Citrus Heights / Antelope Housing Market Update from last year

Citrus Heights Housing Market Data from December

.

Median Housing Market Data

.

Lots going on here.  First in red are the active listings.  You can see that each month there are fewer active listings.  This is normal for this time of year.  I don’t recommend selling your home during these months unless you have to.  Unless the housing market such as last year dictated to do so.
.

In blue in the sold column.  You can see that these numbers drop each month as well for the most part.  In pink looking across that same column.  It looks like the housing prices have leveled off.  Housing prices are not increasing currently.
.

Looking at last year's numbers in December (yellow line).  The number of homes that sold stayed mostly the same.  Also, if you look at the selling price.  Housing prices continue to rise.  Last year would have been a good time to sell your home during the holiday season.

.

In light blue under DOM (days on market).  Each month the DOM goes up.  This is normal.  Most homes that are listed will sit longer on the market.

.

Now let's look at the numbers that drive home prices up.  Of the homes that are pending each month.  They are all around 55% with more than one offer.

.

Of the homes that sold each month.  September had 63% with more than one offer.  October had 64% than 51% and 66%.  Notice the drop in multiple offers in November and the Selling price that month.  It’s lower than the other months.

.

Now let's look at the numbers last year.  Starting with September, 74%, 71%, 64% and 75%. This is what was driving the housing prices up.  Notice again in November.  It had fewer multiple offers and again the selling price dropped.

.

Citrus Heights home prices increased 13%.  This is comparing December home sales to December of last year.  Going back and comparing this same data in prior months.  September was up 24%, October was up 49% and November was 17%.  Notice the housing price increase is getting smaller each month.

.

Of the 88 homes that sold in December of this year.  12 sold for below list price.  Of those 12 homes sold they were on the market for an average of 48 days.

.

Of the 88 homes, 61 sold for over asking.  They were only on the market for about 11 days.  The rest sold at list price.

.

Looking back at last year's numbers.  Of the 104 homes that sold last December.  22 sold below list price.  64 sold for over list price.  The rest sold at list price.

.

September-21


# Listings

List Price

Sale Price

DOM

Active

88

$482,400

$0

15

Pending

158

$459,900

$0

11

Sold

109

$449,000

$460,000

8

Sold 2020

114

$365,000

$370,000

5

 October-21


# Listings

List Price

Sale Price

DOM

Active

63

$474,100

$0

17

Pending

139

$439,997

$0

11

Sold

120

$449,745

$460,000

8

Sold 2020

103

$375,000

$387,406

6

 November-21


# Listings

List Price

Sale Price

DOM

Active

61

$475,000

$0

34

Pending

122

$452,450

$0

8

Sold

94

$439,450

$445,000

9

Sold 2020

112

$374,948

$381,500

7

 December-21


# Listings

List Price

Sale Price

DOM

Active

37

$489,000

$0

43

Pending

105

$464,900

$0

10

Sold

88

$447,450

$459,000

7

Sold 2020

104

$398,250

$407,000

7

.

Average Housing Market Data

.

Using the average housing market data.  It’s good to compare the original price to the list price.  The original price is the home price when it first comes on the market.  The list price is the price when the home goes pending. 

.

In red the list price is lower because some home sellers have had to drop their price.  The bigger the gap the more this is happening.  Interesting the December, the gap is not as large.  This could be from not as many homes on the market. 

.

Looking at last year in blue.  The numbers are very close each month until December when this gap increases.  This indicates a housing market that is on FIRE 🔥.

.

Don’t be too quick to drop your home price this time of year.  It could cost you 💰.  Remember the housing market moves a little slower this time of year.  If you priced your home on the high side, then yes maybe a good time to drop the price some.

.

September-21


# Listings

Orig Price

List Price

Sale Price

DOM

Active

88

$499,238

$496,480

$0

25

Pending

158

$454,435

$449,972

$0

19

Sold

109

$443,995

$439,591

$453,652

17

Sold 2020

114

$366,411

$366,017

$371,584

13

October-21


# Listings

Orig Price

List Price

Sale Price

DOM

Active

63

$478,158

$578,873

$0

31

Pending

139

$451,621

$447,498

$0

19

Sold

120

$451,207

$446,424

$456,990

17

Sold 2020

103

$383,332

$382,627

$389,817

16

November-21


# Listings

Orig Price

List Price

Sale Price

DOM

Active

61

$496,478

$494,549

$0

45

Pending

122

$453,082

$450,829

$0

19

Sold

94

$446,837

$441,644

$449,736

16

Sold 2020

112

$375,271

$373,067

$379,114

13

December-21


# Listings

Orig Price

List Price

Sale Price

DOM

Active

37

$493,318

$487,437

$0

60

Pending

105

$461,036

$458,235

$0

19

Sold

88

$451,535

$448,074

$460,862

19

Sold 2020

104

$396,029

$393,918

$399,300

13


.

When comparing the last 6 months of housing market data this year to the same time last year.  Remember when comparing this data, the information moves much slower.  In red is this year's sales prices.  They have gone up about $10k over the last 4 months.

.

Looking at last year the housing prices increased about $15k during this same time.

.

Citrus Heights home prices are up 20%.  Again, this is comparing the last 6 months this year to the same time last year.

.


Citrus Heights

Home Sales last 6 months


# of Sales

Median List Price

Median Sale Price

DOM

 Sep 20

615

$359,900

$365,000

7

 Sep 21

686

$425,000

$446,250

6

 Oct 20

631

$365,000

$370,000

7

 Oct 21

701

$430,000

$450,000

7

 Nov 20

667

$365,900

$375,000

7

 Nov 21

668

$438,500

$450,500

7

 Dec 20

666

$374,250

$379,000

7

 Dec 21

644

$440,000

$455,000

7


.

Antelope Housing Market Data

.

Median Housing Market Data

.

In blue below shows the current active listings in Antelope.  Only 8 in December which is really low.

.

In red in December is the house's selling price.  Notice the drop from the previous months.

.

Let’s look at the percentage of homes that received multiple offers on the home.  Looking at the homes that were pending at the time of the data.  In September 55% had more than on offer.  In October 62%, then 55%, and in December 57%.

.

Looking at the homes that sold each month.  82% of the homes that sold in September had more than one offer.  In October 53%, 64%, and December had 62%.

.

Last year the home that sold in these same months.  September of last year had 77% with more than one offer.  October had 75%, 71%, and 75%..

From September to December home prices are down in Antelope.  They are down 2%.  If you compare December home sales this year to December last year.  Home prices are up 12%.

.


September-21


# Listings

List Price

Sale Price

DOM

Active

25

$541,000

$0

8

Pending

90

$483,000

$0

7

Sold

49

$449,999

$485,000

7

Sold 2020

68

$389,900

$396,885

5

 October-21


# Listings

List Price

Sale Price

DOM

Active

39

$507,000

$0

16

Pending

61

$499,000

$0

7

Sold

85

$475,000

$492,500

7

Sold 2020

55

$389,900

$405,000

5

 November-21


# Listings

List Price

Sale Price

DOM

Active

18

$501,500

$0

25

Pending

70

$470,000

$0

9

Sold

45

$499,000

$505,000

8

Sold 2020

56

$396,900

$405,000

6

 December-21


# Listings

List Price

Sale Price

DOM

Active

8

$500,500

$0

7

Pending

49

$499,900

$0

9

Sold

55

$459,000

$475,000

9

Sold 2020

65

$419,900

$425,000

7

.

Average Housing Market Data

.

Looking at the original price and list price.  In red are the numbers of the homes that sold that month.  The gap increases as you head to December.  This is normal this time of year.

.

Looking back at these same numbers but last year.  In blue, the list price is higher than the original price.  That’s unusual.  

.

September-21


# Listings

Orig Price

List Price

Sale Price

DOM

Active

25

$593,064

$585,344

$0

17

Pending

90

$476,083

$472,552

$0

12

Sold

49

$463,864

$463,558

$481,918

9

Sold 2020

68

$392,071

$390,676

$397,763

14

October-21


# Listings

Orig Price

List Price

Sale Price

DOM

Active

39

$505,444

$497,050

$0

22

Pending

61

$500,073

$496,531

$0

13

Sold

85

$473,533

$471,189

$481,017

10

Sold 2020

55

$383,721

$384,739

$395,097

8

November-21


# Listings

Orig Price

List Price

Sale Price

DOM

Active

18

$537,811

$530,644

$0

37

Pending

70

$471,729

$467,296

$0

15

Sold

45

$491,304

$488,835

$499,457

13

Sold 2020

56

$388,336

$387,291

$398,836

10

December-21


# Listings

Orig Price

List Price

Sale Price

DOM

Active

8

$512,363

$510,613

$0

28

Pending

49

$499,642

$497,407

$0

18

Sold

55

$466,234

$462,047

$468,847

14

Sold 2020

65

$409,505

$408,662

$415,906

11

.

Comparing the last 6 months of home sales this year to the same time last year.  In red the numbers are close to the same.

.

Looking at last year in gray.  The number of homes that sold each month trended upward.

.

In bright pink, the property selling price has stabilized for now.  Not sure where the housing market will head once March or April rolls around.

.


Home Sales last 6 months


# of Sales

Median List Price

Median Sales Price

DOM

 Sep 20

347

$387,000

$390,000

7

 Sep 21

379

$449,999

$475,000

6

 Oct 20

366

$389,000

$395,000

6

 Oct 21

397

$450,000

$485,000

6

 Nov 20

380

$389,900

$398,000

6

 Nov 21

380

$459,000

$485,000

7

 Dec 20

384

$395,000

$401,500

6

 Dec 21

385

$460,000

$487,000

7


.

Your home is an investment in your quality of life.  My team takes that seriously.  That's why, when we first meet, we focus on the vision you have for your family.  I have a system put in place to get you the best price possible on a home without over-biding.  I want to put you in the best possible position to get a home at the best price.  Please feel free to give me a call, text, or email me to find out how my system works.


We can put a plan together to save you as much money as possible in these circumstances.  It is possible that waiting to buy or sell a home may help you have more fruit later.  Your family home is one of your largest investments.  It's my job to ensure that it yields the highest ROI.  That means making smart decisions that will yield fruit in the future.  Planning is the best way to make this happen.

Posted in Real Estate News
Jan. 14, 2022

Carmichael Housing Market Data from Last Year ????

Carmichael Housing Market Data from December 2021


Median Housing Market Data

Notice in red below.  The sales prices of homes that are sold each month have dropped.  Not sure why.


Looking at the active listings in blue.  The number is fewer each month.  This is normal this time of year.  It’s also normal this time of year for the DOM (days on market) to increase.


Of the homes pending each month let look at how many had multiple offers.  In September 44% had more than on offer.  In October 39%, 57%, and December had 65%.


Looking at the homes that sold each month and how many had more than one offer.  September had 62%, 53%, 48% and December 62%.


Looking back at these same months last year.  September had 67%, 69%, 64% and December 67%. 


When comparing December’s home sales this year to December last year.  Carmichael home prices are up 14%.  But looking at the last 4 months.  Home prices in Carmichael are down 10%. 


September-21


# Listings

List Price

Sale Price

DOM

Active

66

$575,000

$0

28

Pending

86

$545,000

$0

11

Sold

84

$549,950

$575,000

8

Sold 2020

70

$467,000

$473,000

6

 October-21


# Listings

List Price

Sale Price

DOM

Active

74

$534,500

$0

17

Pending

74

$529,500

$0

11

Sold

70

$529,450

$536,000

11

Sold 2020

80

$479,500

$492,250

6

 November-21


# Listings

List Price

Sale Price

DOM

Active

41

$619,000

$0

27

Pending

84

$495,000

$0

13

Sold

64

$529,500

$527,500

10

Sold 2020

63

$429,000

$435,000

7

December-21


# Listings

List Price

Sale Price

DOM

Active

40

$544,500

$0

32

Pending

69

$499,000

$0

7

Sold

71

$500,000

$515,000

9

Sold 2020

88

$446,622

$452,850

7


Let’s look at each of the homes that sold in December.  The homes are listed below.  The homes are sorted by selling percent below list price to the percent above list price.  The far-right column is the amount the sellers dropped or increased their price when it sold.

In red below.  This home was on the market for 106 days.  The agent most likely increased the price once they received an offer.  This drives up the price. Not all agents will do this. In fact, most will not.

In blue below.  This home was clearly well overpriced.

16 homes sold for below list price in December.  41 sold for over list price.  The remaining homes were sold for the list price.


Status

Original Price

List Price

Sold Price

DOM


Percent Above or Below List Price


Price drops/ Increases

Closed

3195000

2950000

2600000

190


-12%


-245000

Closed

412000

398900

376000

138


-6%


-13100

Closed

749900

739900

700000

36


-5%


-10000

Closed

490000

474900

450000

25


-5%


-15100

Closed

524900

479000

455000

79


-5%


-45900

Closed

399000

399000

381000

5


-5%


0

Closed

521000

470000

450000

115


-4%


-51000

Closed

599000

599000

577000

8


-4%


0

Closed

525000

525000

509000

24


-3%


0

Closed

1449000

1449000

1410000

13


-3%


0

Closed

460000

460000

450000

20


-2%


0

Closed

350000

350000

345000

25


-1%


0

Closed

669000

639000

630000

37


-1%


-30000

Closed

750000

725000

715000

18


-1%


-25000

Closed

699000

699000

690000

91


-1%


0

Closed

564000

564000

561000

22


-1%


0

Closed

668000

668000

665500

5


0%


0

Closed

647100

647100

647000

6


0%


0

Closed

440000

460000

460000

106


0%


20000

Closed

640000

525000

525000

141


0%


-115000

Closed

540000

478000

478000

94


0%


-62000

Closed

524900

515000

515000

54


0%


-9900

Closed

549999

515000

515000

43


0%


-34999

Closed

460000

430000

430000

23


0%


-30000

Closed

500000

500000

500000

1


0%


0

Closed

584900

584900

584900

7


0%


0

Closed

410000

410000

410000

17


0%


0

Closed

485000

459950

460000

52


0%


-25050

Closed

319900

319900

320000

9


0%


0

Closed

349000

299000

300000

62


0%


-50000

Closed

699500

750000

755000

6


1%


50500

Closed

415000

415000

418000

18


1%


0

Closed

670000

615000

620000

30


1%


-55000

Closed

511000

495000

500000

86


1%


-16000

Closed

574000

574000

580000

6


1%


0

Closed

699000

499000

505000

157


1%


-200000

Closed

375000

375000

380000

5


1%


0

Closed

515900

515900

525000

4


2%


0

Closed

509900

479900

490000

27


2%


-30000

Closed

665000

665000

680000

6


2%


0

Closed

459000

459000

469500

11


2%


0

Closed

525000

525000

540000

7


3%


0

Closed

630000

630000

650000

4


3%


0

Closed

429000

429000

445000

2


4%


0

Closed

620000

620000

645000

4


4%


0

Closed

720000

720000

750000

9


4%


0

Closed

549900

549900

575000

34


5%


0

Closed

325000

325000

340000

3


5%


0

Closed

529990

529990

555000

4


5%


0

Closed

315000

315000

330000

4


5%


0

Closed

673000

673000

708000

3


5%


0

Closed

498800

498800

525000

3


5%


0

Closed

399000

399000

420000

5


5%


0

Closed

560000

558000

588000

32


5%


-2000

Closed

589000

589000

621000

5


5%


0

Closed

799900

799900

845000

9


6%


0

Closed

299900

299900

320000

3


7%


0

Closed

434900

434900

465500

5


7%


0

Closed

465000

465000

500000

19


8%


0

Closed

409000

409000

440000

5


8%


0

Closed

625000

625000

672900

5


8%


0

Closed

450000

450000

485000

8


8%


0

Closed

850000

850000

925000

7


9%


0

Closed

459000

459000

505000

0


10%


0

Closed

759950

759950

842500

9


11%


0

Closed

315000

315000

350000

2


11%


0

Closed

499000

499000

556000

5


11%


0

Closed

427900

427900

480000

4


12%


0

Closed

925000

925000

1050000

0


14%


0

Closed

500000

500000

570000

6


14%


0

Closed

360000

360000

452000

12


26%


0


Average Housing Market Data

In comparing the original price to the list price.  In red the numbers, each month jump around.  This is most likely caused by a large price drop during that month.  This will throw off the numbers.

Notice December last year in pink.     


September-21


# Listings

Orig Price

List Price

Sale Price

DOM

Active

66

$799,119

$776,502

$0

43

Pending

86

$617,165

$607,452

$0

21

Sold

84

$558,753

$551,176

$563,727

15

Sold 2020

70

$500,084

$494,227

$502,627

14

October-21


# Listings

Orig Price

List Price

Sale Price

DOM

Active

74

$805,181

$783,463

$0

42

Pending

74

$566,662

$560,467

$0

25

Sold

70

$619,023

$606,004

$609,132

19

Sold 2020

80

$518,796

$513,986

$518,841

13

November-21


# Listings

Orig Price

List Price

Sale Price

DOM

Active

41

$901,567

$892,323

$0

44

Pending

84

$591,186

$578,023

$0

34

Sold

64

$550,812

$546,886

$547,756

19

Sold 2020

63

$471,815

$461,366

$459,465

18

December-21


# Listings

Orig Price

List Price

Sale Price

DOM

Active

40

$850,571

$849,896

$0

52

Pending

69

$538,543

$534,700

$0

24

Sold

71

$584,678

$570,670

$580,039

29

Sold 2020

88

$496,953

$496,045

$503,768

12


When comparing the last 6 months of home sales this year to the same time last year. That would be July 1st to December 31st. Looking at this year's numbers in blue. The home prices are stable. No increase.


Last year there was a 1% price increase during these 4 months.


Again, I highly recommend not selling your home unless you must during these months.


To put the most money in your pocket it’s always best to plan. I know selling your home is not fun. I completely understand. Keeping it clean, dealing with the kids, ready at a moment's notice, strangers coming into your home. I get it completely.


That’s why I will go over the housing market conditions with you. Giving you choices of what is best for you at that moment. My goal is always to put the most money in your pocket.


Carmichael

Home Sales last 6 months


Number of Sales

Median List Price

Median Sales Price

DOM

 Sep 20

387

$459,000

$456,000

8

 Sep 21

509

$515,000

$540,000

7

 Oct 20

415

$465,000

$469,000

8

 Oct 21

503

$517,000

$545,000

8

 Nov 20

441

$459,000

$460,000

8

 Nov 21

485

$525,000

$545,000

8

 Dec 20

458

$454,950

$462,000

7

 Dec 21

467

$525,000

$540,000

8


Posted in Real Estate News
Jan. 11, 2022

Roseville / Rocklin Housing Market Data as of January 4th 2022

Roseville Housing Market Data for December 2021


Median Housing Market Data


For the first time in a while the home selling price is below the list price (in red below). This doesn’t mean all homes are sold for less than the list price. Just that the selling price overall is less than the list price. In the previous months in green, the selling price is above the list price.

Looking at each home sale in December individually. Of the 186 homes that sold 42 sold for less than the list price. 37 sold exactly the list price. 107 sold for more than the list price.

Of the 42 homes that sold below the list price, 22 dropped their price. The 42 homes averaged about 36 days on the market or DOM.

Of the 107 homes that sold for over list price, they averaged about 9 days on the market or DOM. 12 of these homes had to drop their price.

Notice the difference. When you price your home too high it will cost you money. Less money in your pocket. You don’t ever want that to happen.


It’s important to know what these numbers are when you buy or sell a home. It’s also important to know how many homes are on the market that is comparable to yours.

Using the median housing market data home prices are up 17%. This is comparing this December’s home sales to last December’s home sales.

Of the homes currently pending 42% have more than one offer. 54% of the homes that sold in December had more than one offer. Of the homes that sold last year in December, 59% had multiple offers.

Looking at the active number of active listings. It trends downward over the last 4 months. This is normal during most housing market conditions.


September-21


# Listings

List Price

Sale Price

DOM

Active

174

$649,700

$0

15

Pending

217

$600,000

$0

9

Sold

212

$600,000

$615,000

6

Sold 2020

272

$502,091

$510,000

8

October-21


# Listings

List Price

Sale Price

DOM

Active

138

$657,540

$0

12

Pending

228

$615,000

$0

11

Sold

207

$589,000

$605,000

7

Sold 2020

250

$519,450

$525,400

7

November-21


# Listings

List Price

Sale Price

DOM

Active

96

$666,658

$0

23

Pending

222

$630,720

$0

10

Sold

189

$620,000

$625,000

8

Sold 2020

216

$507,950

$509,450

6

December-21


# Listings

List Price

Sale Price

DOM

Active

79

$657,200

$0

25

Pending

163

$631,490

$0

9

Sold

186

$623,450

$617,500

8

Sold 2020

217

$525,000

$530,000

7


Average housing Market Data


When looking at the average housing market data.  It’s good to look at the original price and the list price.  The original price is the price of houses when they were first listed.  The list price is the price when the house went pending. 


In red below the gap is getting a little larger each month.  Last year the gap was much smaller. 


September-21


# Listings

Orig Price

List Price

Sale Price

DOM

Active

174

$666,036

$658,218

$0

23

Pending

217

$629,800

$624,356

$0

16

Sold

117

$641,023

$635,831

$648,474

14

Sold 2020

272

$544,729

$540,978

$546,157

20

October-21


# Listings

Orig Price

List Price

Sale Price

DOM

Active

138

$681,184

$674,546

$0

25

Pending

228

$645,186

$637,732

$0

20

Sold

207

$624,782

$618,411

$630,206

14

Sold 2020

250

$550,796

$548,116

$555,147

17

November-21


# Listings

Orig Price

List Price

Sale Price

DOM

Active

96

$677,625

$672,185

$0

32

Pending

222

$636,797

$630,508

$0

20

Sold

189

$650,616

$643,615

$652,241

17

Sold 2020

216

$538,130

$535,825

$539,611

16

December-21


# Listings

Orig Price

List Price

Sale Price

DOM

Active

79

$674,180

$670,805

$0

36

Pending

163

$637,423

$632,468

$0

24

Sold

186

$646,348

$639,255

$648,558

18

Sold 2020

217

$554,892

$552,983

$558,603

15


When comparing the last 6 months of home sales this year to the same time last year. In red below, for the first time in a while, the sales price is less than the list price. The last time this happened was in September of 2020 in blue.


Remember when looking at housing market data over a long period of time. Changes are much more Suttle.

Housing prices are up 18%. This is again comparing the last 6 months sales of this year to the same time last year.


Roseville

Home Sales last 6 months


# of Sales

Median List Price

Median Sales Price

DOM

 Sep 20

1373

$498,900

$497,000

10

 Sep 21

1439

$584,990

$610,000

6

 Oct 20

1490

$499,694

$503,500

9

 Oct 21

1402

$595,000

$615,000

6

 Nov 20

1537

$500,000

$509,000

8

 Nov 21

1366

$595,000

$610,000

6

 Dec 20

1505

$509,999

$515,000

8

 Dec 21

1314

$598,500

$610,000

7


Rocklin Housing Market Data for December 2021


Median Housing Market Data


In red below are the active listings. Each month these drop some. This is normal for this time of year. And in most housing market conditions.

In Rocklin of the 79 homes that sold in December. 16 sold for less than the list price. 15 sold for exactly the list price. 48 sold for over list price.

Of the 16 homes that sold for below list price, 5 dropped the price. 2 of the 16 increased their price. This raises questions. These 16 homes averaged 35 days on the market or DOM.

Of the homes that sold for over list price. 4 dropped their price. These homes averaged 9 days on the market or DOM.


September-21


# Listings

List Price

Sale Price

DOM

Active

61

$699,500

$0

14

Pending

114

$650,000

$0

8

Sold

96

$629,500

$640,000

8

Sold 2020

115

$535,000

$550,000

6

 October-21


# Listings

List Price

Sale Price

DOM

Active

63

$660,000

$0

12

Pending

123

$659,000

$0

7

Sold

94

$650,000

$650,000

7

Sold 2020

141

$539,000

$540,000

8

 November-21


# Listings

List Price

Sale Price

DOM

Active

43

$675,000

$0

22

Pending

108

$677,743

$0

8

Sold

106

$637,500

$650,000

6

Sold 2020

140

$565,000

$567,500

8

 December-21


# Listings

List Price

Sale Price

DOM

Active

30

$721,450

$0

25

Pending

81

$690,990

$0

7

Sold

79

$669,900

$680,000

7

Sold 2020

114

$549,950

$559,500

7


Average Housing Market Data


Important to notice how different the prices are between the median and the average.

It's always good to compare the original price and the list price when looking at these numbers. Like Roseville, the gap is getting wider each month. This means that homeowners are having to drop their prices more to get the home sold (in red).


In blue below the gap between the original price and list price are closer.

Days on market or DOM go up each month. This is normal for this time of year. We hopefully will start to see these numbers come down as we move toward March and April.


September-21


# Listings

Orig Price

List Price

Sale Price

DOM

Active

61

$770,867

$758,779

$0

22

Pending

114

$707,462

$702,531

$0

17

Sold

96

$669,791

$665,744

$679,490

15

Sold 2020

115

$551,008

$550,744

$559,298

19

October-21


# Listings

Orig Price

List Price

Sale Price

DOM

Active

63

$722,353

$717,848

$0

24

Pending

123

$741,286

$732,566

$0

15

Sold

94

$705,595

$700,030

$712,961

14

Sold 2020

141

$561,492

$557,988

$561,636

20

November-21


# Listings

Orig Price

List Price

Sale Price

DOM

Active

43

$741,689

$738,165

$0

32

Pending

108

$737,152

$725,924

$0

18

Sold

106

$714,286

$710,447

$732,180

13

Sold 2020

140

$575,682

$573,474

$581,197

17

December-21


# Listings

Orig Price

List Price

Sale Price

DOM

Active

30

$726,901

$721,083

$0

38

Pending

81

$742,875

$739,981

$0

16

Sold

79

$720,093

$706,978

$715,503

17

Sold 2020

114

$571,159

$568,912

$575,949

15


In blue below the sales price seems to have stabilized. This is comparing the last 6 months of home sales this year to the same time last year. However, it is normal this time of year for home prices to stay flat. There are fewer homes on the market but also fewer buyers shopping this time of year.


Be careful this time of year when lowering your home price if you are selling.  It may just be on the market longer because of the time of year.  If you priced your home high from the start, then it may be time to drop the price some. 


Home Sales last 6 months


# of Sales

Median List Price

Median Sale Price

DOM

 Sep 20

606

$539,000

$540,000

11

 Sep 21

685

$630,000

$652,000

6

 Oct 20

695

$539,900

$545,000

11

 Oct 21

682

$639,000

$655,000

6

 Nov 20

774

$542,000

$550,000

10

 Nov 21

661

$639,000

$650,888

6

 Dec 20

888

$544,500

$550,000

9

 Dec 21

742

$639,450

$655,000

7


Posted in Real Estate News
Jan. 4, 2022

Sacramento Area Real Estate Agent Promotes Homes to MORE Buyers for MORE Money.

As the real estate market continues to change, one local agent has mastered the art of “Target Marketing” to expose their properties to the most opportune buyers, thus selling them for more money.

Rocklin, California – January 4, 2022 – If you’ve followed the Sacramento real estate market for a while, you’ve undoubtedly heard of Robert Bittle as he’s one of the most respected agents in town when it comes to marketing homes to sell for the most amount of money. Now, he’s one-upped himself with the latest addition to his advertising arsenal with what he calls his “Target Marketing” approach.

The ancient approach of placing your home in local magazines, along with the rest of the listings that your listing brokerage has is now a thing of the past. Robert Bittle has perfected an approach to Target Marketing where he invests his own money to expose your property to the most opportune buyer based on their current interests, hobbies, family size, age and even net worth and credit score.

In today’s world, marketing is all about matching your product up to the prospects that are most likely to have an interest in it. Much like when you are at the grocery and you see that coupons print out based on the products that you always tend to buy.

When asked how this new-age approach to selling for more homes works, Robert said the following: “If a home is in a highly desirable school district, that usually comes with a little bit higher property tax base. There’s no sense in marketing that home to retired couples but it’s a perfect fit for a family that has a child or two of school-age years. If the home has a fenced yard, we can expose it to those that have the appropriate income and also have a dog in the house. If it has a wine cellar, we can market to those that subscribe to Wine Connoisseur Magazine or otherwise have a wine collection. This allows buyers to absolute fall in love with the home, oftentimes meaning they’ll pay a premium for something that matches their exact criteria. Essentially, we can market it as their “Dream Home” even though it would be considered “just another home for sale” to the general public. That’s why oftentimes we can sell homes for more money. With the marketing data available from online and offline marketing firms, it just doesn’t make sense for an agent to simply list a home on the MLS system and wait for a possible contract sometime down the road.”

For local homeowners, selling your home fast and for top dollar is our biggest priority. Utilizing an agent that understands superior marketing and exposure can potentially allow you to net a lot more money from the ultimate sale of the property.

About Robert Bittle:


For more information on how this target marketing approach works and to find out how you may be able to get more from the sale of your home, contact Robert Bittle at Realty ONE Group Complete by calling or texting to (916) 634-0505 or email rob@robbittle.com

Posted in Real Estate News
Dec. 15, 2021

Distributions of Home Sales in Sacramento County

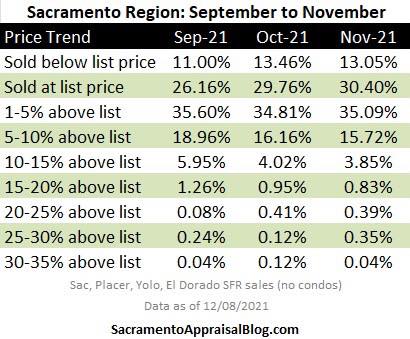
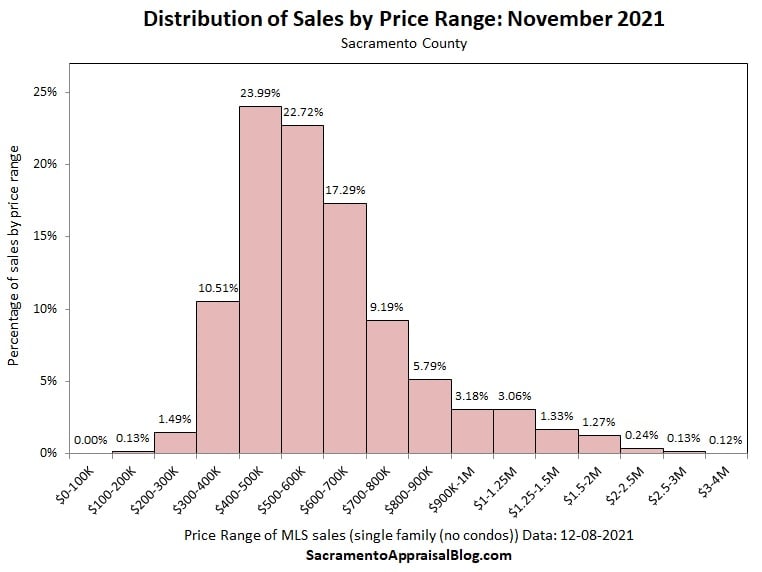
Here's some interesting housing market data. Where do you think the Sacramento housing market is headed?  Two graphs below show what is currently happening in the Sacramento area.  

Ryan Lundquist a Sacramento Appraiser made this graph.  A link below to his Facebook page.


https://www.facebook.com/SacramentoAppraiser/


Posted in Real Estate News
Dec. 12, 2021

Elk Grove Housing Market Data for zip code 95758 and Laguna West Lakeside Neighborhood for November 2021

Elk Grove Zip Code 95758 Housing Market Data for November 2021


Median Home Sales Data


Homes in this zip code are selling for well over the list price.  This does not mean all homes are selling for over-list price.

In August the difference is $25,000.  In September it’s about $30,000. October it’s about $22,000.  And in November it’s $20,000.  This is happening because of the multiple offers.

Of the homes that sold in August, 68% had more than one offer.  62% in September, 68% in October, and 62% in November.

Right now, is a great time to buy a home if you are looking to buy.  Looking at the DOM in green.  Homes are staying on the market much longer now.  In November it’s up to 41 days.


Looking at the active listings in blue.  You can see that this number is dropping.  This is all normal.

In most housing markets it’s normal for DOM to go up and active listings to drop.  This is because of the holidays.


The zip code of 95758 is up 24%.  This is comparing November home sales this year to November last year.  Home prices are up from last month about 1.7%.


August-21


Active Listings

List Price

Sale Price

DOM

Active

40

$567,500

$0

9

Pending

89

$549,000

$0

8

Sold

79

$525,000

$550,000

7

Sold 2020

79

$415,000

$420,000

8

September-21


Active Listings

List Price

Sale Price

DOM

Active

28

$599,000

$0

9

Pending

93

$545,000

$0

8

Sold

79

$529,900

$560,000

8

Sold 2020

82

$442,000

$458,000

6

 October-21


Active Listings

List Price

Sale Price

DOM

Active

33

$575,000

$0

16

Pending

86

$552,500

$0

7

Sold

77

$538,000

$560,000

8

Sold 2020

80

$434,450

$450,000

5

 November-21


Active Listings

List Price

Sale Price

DOM

Active

16

$629,900

$0

41

Pending

61

$550,000

$0

8

Sold

66

$560,000

$570,000

7

Sold 2020

80

$440,000

$460,250

7


Average Housing Market Data


Using the average housing market data.  Looking at the original price and list price in red.  These numbers for the most part are very close.  This means that sellers are not having to drop their price to get their home sold.

In October the gap is a little more.  This means more sellers dropped their home price to get it sold.  This is normal during the holiday season.

Looking at November the price actually went up.  This means that some sellers raised their price.  This usually happens when the seller receives multiple offers.

Looking at the same number but last year in green.  Mostly the same.


August-21


# Listings

Orig Price

List Price

Sale Price

DOM

Active

40

$608,302

$595,162

$0

16

Pending

89

$580,192

$578,021

$0

14

Sold

79

$545,217

$545,185

$571,163

10

Sold 2020

79

$425,285

$425,128

$429,336

20

September-21


# Listings

Orig Price

List Price

Sale Price

DOM

Active

28

$667,623

$662,838

$0

15

Pending

93

$573,609

$568,541

$0

16

Sold

79

$571,390

$570,388

$584,207

11

Sold 2020

82

$458,500

$458,151

$469,000

13

October-21


# Listings

Orig Price

List Price

Sale Price

DOM

Active

33

$618,616

$613,474

$0

23

Pending

86

$586,537

$585,603

$0

13

Sold

77

$563,365

$559,334

$573,978

16

Sold 2020

80

$451,599

$450,458

$461,839

10

November-21


# Listings

Orig Price

List Price

Sale Price

DOM

Active

16

$673,137

$663,481

$0

42

Pending

61

$584,730

$582,614

$0

15

Sold

66

$574,028

$578,624

$596,271

10

Sold 2020

80

$467,754

$467,277

$480,773

16


Looking at the last 6 months of home sales in the zip code of 95758. Looking at this year in red. The list price is much less than the sales price. This is being caused by multiple offers. August was about $40,000 above the list price. This area is seeing more multiple offers than other areas.

Looking at last year in green. The sales price is about $5,000 more than the sales price. Until November of last year where it jumps to about $10,000. It has continued to rise from there.

With this going back the last 6 months. Any housing market movement will show much slower.


Home Sales last 6 months


Number of Sales

Median List Price

Median Sales Price

DOM

 Aug 20

388

$415,000

$420,000

8

 Aug 21

392

$499,000

$540,000

6

 Sep 20

423

$420,000

$425,000

8

 Sep 21

422

$509,950

$546,750

6

 Oct 20

460

$425,000

$430,000

7

 Oct 21

457

$519,000

$550,000

7

 Nov 20

485

$429,900

$438,000

7

 Nov 21

460

$529,000

$555,000

7


Elk Grove’s Laguna West Lakeside Neighborhood


Median Housing Market Data


Looking at the last 6 months of home sales in your neighborhood. In red which is this year. Homes are selling for roughly $40,000 over list price. Again, being caused by multiple offers. Or more home buyers than sellers.


Going back and looking at the number from last year in green. Homes sold for about $10,000 over list price.

Looking at the active listings. Last year's home sales are much higher. The price increasing so much can be related to the low inventory.

Home prices have increased at a much high level this year.


August Back 6 Months


Active Listings

List Price

Sale Price

DOM

Sold 2020

99

$489,000

$495,000

8

Sold 2021

72

$559,450

$604,000

6

September Back 6 Months


Active Listings

List Price

Sale Price

DOM

Sold 2020

102

$482,450

$492,500

7

Sold 2021

85

$574,000

$610,000

7

October Back 6 Months


Active Listings

List Price

Sale Price

DOM

Sold 2020

102

$482,450

$492,500

7

Sold 2021

85

$574,000

$610,000

7

November Back 6 Months


Active Listings

List Price

Sale Price

DOM

Sold 2020

105

$489,000

$496,000

7

Sold 2021

88

$579,450

$610,000

7


Posted in Real Estate News
Dec. 11, 2021

Citrus Heights / Antelope Housing Market Update for December 2021

Citrus Heights Housing Market Data from November


Median Housing Market Data

The numbers that stand out when looking at the median housing market data.  In red below under sales price.  The selling price is beginning to flatten out.  Not only is the selling price starting to flatten out.  The list price and the selling price are starting to get closer (this is in green and red below).  This is indicating that the housing market is starting to slow or flatten in most cases.  These numbers are normal for this time of year.  So, we will see moving forward.


Housing prices in Citrus Heights are up 17%.  This is comparing November this year to November last year.  The housing market is down almost 3% from last month.  This time of year, it’s normal for prices to drop some.  It's also normal for DOM to increase and active listings to decrease.

Of the homes that sold in Citrus Heights in November, 51% had more than one offer.  64% had multiple offers in October.  That is a large drop in one month.  In November last year, 64% had more than one offer.  This data could mean the housing market is softening some.


** This time of year, your home will be on the market longer and sell for less in most housing markets situations.  Putting a plan together with a good Realtor can put money in your pocket.


** Frist time home buyers, this is a great time to buy a home!  Fewer home buyers to compete with and less serious homebuyers looking.


August-21


# Listings

List Price

Sale Price

DOM

Active

89

$459,000

$0

16

Pending

131

$459,900

$0

10

Sold

112

$439,450

$451,000

7

Sold 2020

116

$364,700

$370,000

5

September-21


# Listings

List Price

Sale Price

DOM

Active

88

$482,400

$0

15

Pending

158

$459,900

$0

11

Sold

109

$449,000

$460,000

8

Sold 2020

114

$365,000

$370,000

5

 October-21


# Listings

List Price

Sale Price

DOM

Active

63

$474,100

$0

17

Pending

139

$439,997

$0

11

Sold

120

$449,745

$460,000

8

Sold 2020

103

$375,000

$387,406

6

 November-21


# Listings

List Price

Sale Price

DOM

Active

61

$475,000

$0

34

Pending

122

$452,450

$0

8

Sold

94

$439,450

$445,000

9

Sold 2020

112

$374,948

$381,500

7


Average Housing Market Data


Looking at the average housing market data.  Look at the original price compared to the list price.  This is the original list price compared to the price when the home goes pending.

In red below, in August they are almost the same.  Now looking down at November you can see this margin has larger.  This means that more home sellers are having to drop their prices to get their home sold.


Looking back at last year in green.  Last year the numbers are much closer all 4 months.  The housing market started to take off in July last year. Again, it is normal this time of year for homes to take longer to sell at a lower price.


Using the average housing market data for Citrus Heights.  Home prices are up 17%.  This is comparing this November's homes sales to last November's home sales.


August-21


# Listings

Orig Price

List Price

Sale Price

DOM

Active

89

$476,721

$472,540

$0

25

Pending

131

$465,420

$460,184

$0

19

Sold

112

$440,913

$440,296

$454,639

12

Sold 2020

116

$361,440

$360,326

$365,015

16

September-21


# Listings

Orig Price

List Price

Sale Price

DOM

Active

88

$499,238

$496,480

$0

25

Pending

158

$454,435

$449,972

$0

19

Sold

109

$443,995

$439,591

$453,652

17

Sold 2020

114

$366,411

$366,017

$371,584

13

October-21


# Listings

Orig Price

List Price

Sale Price

DOM

Active

63

$478,158

$578,873

$0

31

Pending

139

$451,621

$447,498

$0

19

Sold

120

$451,207

$446,424

$456,990

17

Sold 2020

103

$383,332

$382,627

$389,817

16

November-21


# Listings

Orig Price

List Price

Sale Price

DOM

Active

61

$496,478

$494,549

$0

45

Pending

122

$453,082

$450,829

$0

19

Sold

94

$446,837

$441,644

$449,736

16

Sold 2020

112

$375,271

$373,067

$379,114

13


Looking at the last 6 months of home sales this year compared to the same time last year.  In red, you can see the home price continues to increase. Until November where home prices only increased a small amount.

In green is last year’s home selling price.  You can see that they slightly increased at the beginning of each month.  Then prices started to increase more in the last few months.


These numbers move much slower than the month-to-month data.


When comparing the last 6 months on home sales this year to the same time last year.  Home prices are up 20%.  Over the last 2 months, home prices are only up about 1%.


Citrus Heights

Home Sales last 6 months


# of Sales

Median List Price

Median Sale Price

DOM

 July 20

526

$355,000

$360,000

8

 July 21

612

$419,000

$435,000

6

 Aug 20

576

$359,000

$362,250

7

 Aug 21

668

$425,000

$440,000

5

 Sep 20

615

$359,900

$365,000

7

 Sep 21

686

$425,000

$446,250

6

 Oct 20

631

$365,000

$370,000

7

 Oct 21

701

$430,000

$450,000

7

 Nov 20

667

$365,900

$375,000

7

 Nov 21

668

$438,500

$450,500

7


Antelope Housing Market Data


Median Housing Market Data


Looking at the median housing market data. In red below you can see month over month of home price increases. Each month the selling price seems to get even larger in Antelope. Normally this time of year you see home prices drop some. You also see homes on the market longer with fewer homes that are active.


Looking at November.  Home sellers putting their homes on the market increased their price by a large margin.  In October the list price was $475,000 and in November it’s $499,000.  This could explain the narrowing gap between list price and selling price.  This means fewer homes are selling above the list price.  It’s normal this time of year for this gap to get closer.


64% of the homes that sold in November had more than one offer.  In November last year, 71% had more than one offer.


Home prices in Antelope are up 25% when comparing November home sales this year to November last year.


Home prices are up almost 3% from last month.


August-21


# Listings

List Price

Sale Price

DOM

Active

33

$524,000

$0

11

Pending

71

$450,000

$0

7

Sold

58

$454,500

$480,000

7

Sold 2020

73

$392,777

$396,000

7

September-21


# Listings

List Price

Sale Price

DOM

Active

25

$541,000

$0

8

Pending

90

$483,000

$0

7

Sold

49

$449,999

$485,000

7

Sold 2020

68

$389,900

$396,885

5

 October-21


# Listings

List Price

Sale Price

DOM

Active

39

$507,000

$0

16

Pending

61

$499,000

$0

7

Sold

85

$475,000

$492,500

7

Sold 2020

55

$389,900

$405,000

5

 November-21


# Listings

List Price

Sale Price

DOM

Active

18

$501,500

$0

25

Pending

70

$470,000

$0

9

Sold

45

$499,000

$505,000

8

Sold 2020

56

$396,900

$405,000

6


Average Housing Market Data

The average housing market data is good at showing the original price and the list price.  These numbers represent how close the home price is when it goes pending.  In red below September is almost the same.  This means that fewer home sellers had to drop their prices.  The gap in November got larger. You can also see that home sellers increased their listing price compared to October.  As stated above.


August-21


# Listings

Orig Price

List Price

Sale Price

DOM

Active

33

$526,261

$517,536

$0

17

Pending

71

$467,822

$467,780

$0

11

Sold

58

$459,062

$457,131

$473,780

10

Sold 2020

73

$393,573

$392,703

$396,370

19

September-21


# Listings

Orig Price

List Price

Sale Price

DOM

Active

25

$593,064

$585,344

$0

17

Pending

90

$476,083

$472,552

$0

12

Sold

49

$463,864

$463,558

$481,918

9

Sold 2020

68

$392,071

$390,676

$397,763

14

October-21


# Listings

Orig Price

List Price

Sale Price

DOM

Active

39

$505,444

$497,050

$0

22

Pending

61

$500,073

$496,531

$0

13

Sold

85

$473,533

$471,189

$481,017

10

Sold 2020

55

$383,721

$384,739

$395,097

8

November-21


# Listings

Orig Price

List Price

Sale Price

DOM

Active

18

$537,811

$530,644

$0

37

Pending

70

$471,729

$467,296

$0

15

Sold

45

$491,304

$488,835

$499,457

13

Sold 2020

56

$388,336

$387,291

$398,836

10


The data below compares the last 6 months of data this year to the same time last year.  In red below, the home prices increased each month until November.  It is normal this time of year for home selling prices to drop some.  It’s also normal for DOM to go up as well.

Looking at the data from last year in green.  You can see that the home prices increase each month.

Home prices are up 22% in Antelope.  This is comparing the last 6 months this year to the same time last year.  Over the last 2 months, home prices are up about 2% in Antelope.


Home Sales last 6 months


# of Sales

Median List Price

Median Sales Price

DOM

 July 20

287

$375,000

$380,000

8

 July 21

352

$441,950

$460,000

6

 Aug 20

319

$384,900

$387,200

7

 Aug 21

384

$449,000

$467,000

6

 Sep 20

347

$387,000

$390,000

7

 Sep 21

379

$449,999

$475,000

6

 Oct 20

366

$389,000

$395,000

6

 Oct 21

397

$450,000

$485,000

6

 Nov 20

380

$389,900

$398,000

6

 Nov 21

380

$459,000

$485,000

7


Your home is an investment in your quality of life. My team takes that seriously. That's why, when we first meet, we focus on the vision you have for your family. I have a system put in place to get you the best price possible on a home without over-biding. I want to put you in the best possible position to get a home at the best price. Please feel free to give me a call, text, or email me to find out how my system works.


We can put a plan together to save you as much money as possible in these circumstances. It is possible that waiting to buy or sell a home may help you have more fruit later. Your family home is one of your largest investments. It's my job to ensure that it yields the highest ROI. That means making smart decisions that will yield fruit in the future. Planning is the best way to make this happen.


Posted in Real Estate News