March 14, 2023

Carmichael Housing Market Data for February 2023

Carmichael Housing Market Data for February 2023

.

Median Housing Market Data

.

Housing prices dropped 👇 6% in Carmichael from this time last year.  So with the pick housing market here, where is the market heading?  Let's look at a few numbers.

.

The active listings (inventory) and DOM give us some insight.  This is the time of year when inventory starts to increase in a normal market.  It has continued to drop in Carmichael.  This is highlighted in blue below.

.

A normal housing market would see the DOM start to decrease.  The DOM did drop in February.  This is highlighted in green below.  This tells us that more people are out looking to buy a home.

.

Multiple offers are another data point to watch.  Of the homes currently pending, 51% had more than one offer.  Last month the homes pending were at 57%—such a small drop.

.

Of the homes that sold in February, 59% had more than one offer.  Last month 33% had more than one offer.  These numbers are way down from last year.  82% had more than one offer last year.

.

One concerning point is the continued drop in housing prices.  Housing prices are down 👇 9% from December in Carmichael.  We will need to watch these numbers in the coming months.  I believe more homebuyers are buying smaller, lesser expensive homes.  This is to keep their monthly mortgage payments affordable with the high-interest rates.

.

This is the time to sell your home if you are considering it.  This time of year, you will receive the best possible price.  If inventory stays low, it will only help home sellers.

.

I do offer my clients a "Rejuvenation Program" to help with updates when you are ready to sell.  This can help home sellers receive higher offers and for their homes to sell quickly.  There are restrictions on the program.  Please call for details.

.

For more housing information, visit my blog at https://www.allcahomes.com/blog/

.


December-22


# Listings

List Price

Sale Price

DOM

Active

58

$599,000

$0

53

Pending

31

$529,950

$0

52

Sold

38

$532,000

$530,000

20

Sold 2021

66

$515,000

$525,000

9

January-23


# Listings

List Price

Sale Price

DOM

Active

45

$559,000

$0

69

Pending

37

$525,000

$0

26

Sold

27

$575,000

$533,000

44

Sold 2022

62

$480,500

$473,000

6

February-23


# Listings

List Price

Sale Price

DOM

Active

28

$661,995

$0

22

Pending

35

$524,999

$0

21

Sold

32

$510,000

$481,500

20

Sold 2022

49

$495,000

$510,000

7

Posted in Real Estate News
March 14, 2023

Rocklin Housing Market Data for February 2023

Rocklin Housing Market Data for February 2023


Median Housing Market Data

.

Rocklin housing prices are down 5% from this time last year.  This is the time of year when the housing market usually starts to take off. 

.

Looking at the number below the inventory (active listings) and DOM, tell us what is happening.  The inventory dropped, but not by much.  We do have more inventory than last year in February.  This is highlighted in green below. 

.

The DOM usually starts to drop this time of year.  In December, houses sat on the market for 63 days.  In January, that number dropped slightly to 59 days.  In February, it dropped down to 29 days. 

.

In short, the inventory should start to rise, and the DOM start to drop.  These numbers will tell us much about where the housing market is heading. 

.

The multiple offers are the other number that plays a role in housing prices.  Of the homes pending in January, 31% had more than one offer.  In February, 27%. 

.

This is the time to sell your home if you are considering it.  This time of year, you will receive the best possible price.  If inventory stays low, it will only help home sellers.

.

I do offer my clients a "Rejuvenation Program" to help with updates when you are ready to sell.  This can help home sellers receive higher offers and for their homes to sell quickly.  There are restrictions on the program.  Please call for details.

.

For more housing information, visit my blog at https://www.allcahomes.com/blog/

.


December-22


# Listings

List Price

Sale Price

DOM

Active

84

$734,700

$0

63

Pending

44

$773,500

$0

38

Sold

49

$659,000

$650,000

26

Sold 2021

81

$679,000

$690,000

7

January-23


# Listings

List Price

Sale Price

DOM

Active

86

$819,995

$0

59

Pending

52

$678,475

$0

41

Sold

41

$675,000

$645,000

31

Sold 2022

68

$681,098

$702,500

7

February-23


# Listings

List Price

Sale Price

DOM

Active

77

$815,000

$0

29

Pending

74

$744,000

$0

27

Sold

33

$635,000

$639,000

37

Sold 2022

62

$654,000

$669,000

6

Posted in Real Estate News
March 14, 2023

Citrus Heights Housing Market Data for February 2023

Citrus Heights Housing Market Data for February 2023

Median Housing Market Data    🏡

.

This is the time of year when the housing market starts to take off. Citrus Heights housing prices are down 8% from this time last year. We will have to watch the housing numbers to see.

.

Here is some of the critical housing data to watch to know where it is going: the active listings (inventory) and DOM. We are just getting into the hot time of year for the housing market. The active listings usually start to increase this time of year. However, it continues to decrease. This is highlighted in blue below. This could be because of the high-interest rates. Homeowners may not want to move and pay that increased mortgage amount. We will need to watch this number in the coming months.

.

The DOM starts typically to decrease this time of year. This does appear to be happening. It dropped from 49 to 37. This is highlighted in green below.

.

Multiple offers are another area to watch. With low inventory, multiple offers could start to increase. Of the homes currently pending in Citrus Heights, 62% have more than one offer. That number did improve from last month pending's at 49%. We will watch this as well moving forward.

.

Of the homes that sold in February, 57% had more than one offer. In February, 48% had more than one offer.

.

One sign of a declining housing market is the number of home sales. The total number of home sales has dropped across this whole area. In the last 6 months in Citrus Heights, 334 homes sold. Last year at this same time, 601 homes sold. Almost half of the total home sales from a year ago.

.

This is the time to sell your home if you are considering it. This time of year, you will receive the best possible price. If inventory stays low, it will only help home sellers. But you will have to pay higher interest rates to purchase a new home. Something to think about.

.

I do offer my clients a "Rejuvenation Program" to help with updates when you are ready to sell. This can help home sellers receive higher offers and for their homes to sell quickly. There are restrictions on the program. Please call for details.

.

For more housing information, visit my blog at https://www.allcahomes.com/blog/

.


December-22


# Listings

List Price

Sale Price

DOM

Active

80

$464,500

$0

49

Pending

42

$449,450

$0

26

Sold

50

$437,000

$441,500

18

Sold 2021

79

$465,000

$472,500

7

January-23


# Listings

List Price

Sale Price

DOM

Active

55

$489,990

$0

49

Pending

68

$431,000

$0

24

Sold

31

$464,000

$460,000

26

Sold 2022

79

$449,900

$475,000

7

February-23


# Listings

List Price

Sale Price

DOM

Active

40

$544,000

$0

37

Pending

68

$461,995

$0

23

Sold

61

$439,900

$440,000

21

Sold 2022

90

$459,900

$480,000

6

Posted in Real Estate News
Feb. 9, 2023

Antelope Housing Market Sales Data for January

Antelope Housing Market Data for January 2023

.

Median Housing Market Data

.

Home prices in Antelope have dropped 6% from January last year. Home prices have been flat since September. The biggest number that jumps out is the total number of home sales (highlighted in blue).

.

The one big concern is where the housing market is headed. There has been a drastic drop in the total number of home sales. Over the last 6 months, there have been 214 homes sold in Antelope. Last year during the same time, 351 homes sold. This year's housing market will be much slower due to the higher interest rates. Home prices will continue to drop slightly.

.

With the higher interest rates, homebuyers have either stopped looking. Or Homebuyers are looking at less expensive homes.

.

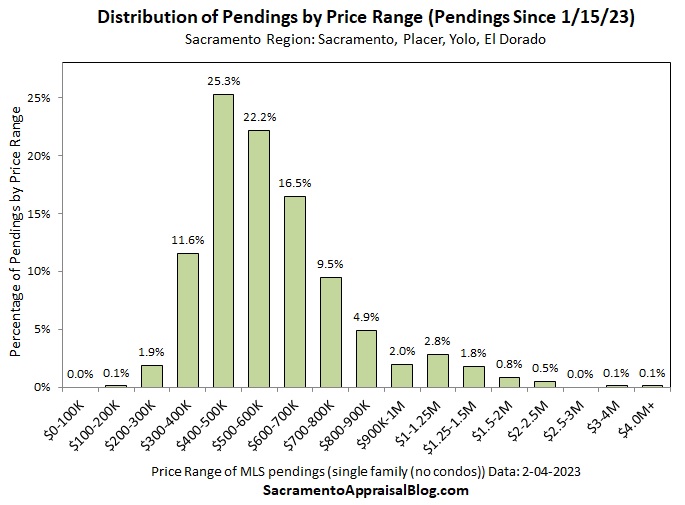
The chart below shows all the homes pending from January 15th in Sacramento County. The sweet spot is from 400k to 500k. Ryan Lundquist, a Sacramento area appraiser, completed this chart.

https://www.facebook.com/SacramentoAppraiser

.

The active listings and the DOM are looking normal this time of year. The Active listings drop during the holidays. For two reasons, lack of homebuyers and the holidays. This number should start to climb in March. The DOM normally goes up this time of year. This is for the same reasons as the active listings. The DOM should start to decrease in March.

.

The best time to sell a home is from March to June. March is when the housing market usually starts to take off. Once the children go back to school, there are fewer homebuyers.

.

For more housing information, visit my blog at https://www.allcahomes.com/blog/.

.

November-22


# Listings

List Price

Sale Price

DOM

Active

62

$501,000

$0

44

Pending

30

$482,500

$0

33

Sold

28

$464,500

$453,250

26

Sold 2021

46

$499,500

$505,000

7

December-22


# Listings

List Price

Sale Price

DOM

Active

37

$489,900

$0

39

Pending

20

$499,900

$0

36

Sold

30

$477,500

$462,500

36

Sold 2021

52

$475,000

$499,950

10

January-23


# Listings

List Price

Sale Price

DOM

Active

34

$499,998

$0

33

Pending

26

$482,000

$0

21

Sold

17

$480,000

$475,000

28

Sold 2022

40

$502,500

$511,000

9


.


I want to put you in the best possible position to get a home at the best price.  I have a method to bring you the best price possible on a home without over-biding.  Please feel free to give me a call, text, or email to find out how my system works.

.


We can put a plan together to save you as much money as possible in these circumstances.  It is possible that waiting to buy or sell a home may help you have more fruit later.  Your family home is one of your most significant investments.  It's my job to ensure that it yields the highest ROI.  That means making smart decisions that will yield fruit in the future.  Planning is the best way to make this happen.

Posted in Real Estate News
Feb. 9, 2023

Rocklin Housing Market Data for January 2023

Rocklin Housing Market Data for January 2023


Median Housing Market Data

.

Rocklin home prices are down 8% from January last year.  November, December, and January are usually the slowest months for home sales.

.

Looking at the active listings and the DOM. It's normal for the active listings to drop this time of year (highlighted in green on the left). It's normal for this to start ticking upward.  This usually starts to tip upward in March. It's normal for the DOM to increase (highlighted in green on right).  This number in a normal housing market should start to decrease.  This would happen over the next couple of months.

.

The one big concern is where the housing market is headed.  The drop in the total number of home sales (highlighted in blue) raises this concern.  There has been a drastic drop in the total number of home sales.  Looking back over the last 6 months, there have been 293 homes sold in Rocklin.  Last year during the same time, 537 homes sold.  I think the housing market this year will be much slower due to the higher interest rates.

.

With the higher interest rates, homebuyers have to look at less expensive homes to afford the monthly payment. The chart below shows all the homes pending from January 15th in Sacramento County.  The sweet spot is from 400k to 500k. Ryan Lundquist, a Sacramento area appraiser, completed this chart.

https://www.facebook.com/SacramentoAppraiser

.

For more housing information, visit my blog at https://www.allcahomes.com/blog/

.

November-22


# Listings

List Price

Sale Price

DOM

Active

124

$737,500

$0

44

Pending

55

$679,000

$0

32

Sold

35

$699,950

$675,000

36

Sold 2021

102

$649,500

$657,500

6

December-22


# Listings

List Price

Sale Price

DOM

Active

84

$734,700

$0

63

Pending

44

$773,500

$0

38

Sold

49

$659,000

$650,000

26

Sold 2021

81

$679,000

$690,000

7

January-23


# Listings

List Price

Sale Price

DOM

Active

86

$819,995

$0

59

Pending

52

$678,475

$0

41

Sold

41

$675,000

$645,000

31

Sold 2022

68

$681,098

$702,500

7

.


.

I want to put you in the best possible position to get a home at the best price.  I have a system to bring you the best price possible on a home without over-biding.  Please feel free to call, text, or email me to find out how my system works.

.


We can put a plan together to save you as much money as possible in these circumstances.  It is possible that waiting to buy or sell a home may help you have more fruit later.  Your family home is one of your most significant investments. It's my job to ensure that it yields the highest ROI.  That means making smart decisions that will produce fruit in the future.  Planning is the best way to make this happen.

Posted in Real Estate News
Feb. 9, 2023

Roseville’s Housing Market Numbers for January 2023

Roseville’s Housing Market Numbers for January 2023

.

Median Housing Market Data

.

Roseville housing prices are down 2% when compared to last January.  Home prices have been flat for the last several months in Roseville.  The biggest number that jumps out is the total number of home sales (highlighted in blue).  This number has dropped off.

.

The one big concern is where the housing market is headed.  There has been a drastic drop in the total number of home sales.  Looking back over the last 6 months, there have been 845 homes sold in Roseville.  Last year during the same time, 1208 homes sold.  This year's housing market will be much slower due to the higher interest rates.  Home prices will continue to drop slightly.

.

With the higher interest rates, homebuyers have either stopped looking.  Or Homebuyers are looking at less expensive homes.

.

The chart below shows all the homes pending from January 15th in Sacramento County.  The sweet spot is from 400k to 500k.  Ryan Lundquist, a Sacramento area appraiser, completed this chart.

https://www.facebook.com/SacramentoAppraiser

.

The active listings and DOM look normal for the time of year.  The active listings dropped.  Normal, as home sellers have less traffic during this time of year.  Sellers also pull their homes off the market because of the holidays.  The DOM also looks normal for this time of year.  It’s normal for the DOM to increase.  Around March, I expect to see both the active listings and DOM start changing.

.

For more housing information, visit my blog at https://www.allcahomes.com/blog/

.

November-22


# Listings

List Price

Sale Price

DOM

Active

289

$659,990

$0

54

Pending

139

$617,312

$0

31

Sold

129

$600,000

$604,000

25

Sold 2021

193

$625,000

$629,000

8

December-22


# Listings

List Price

Sale Price

DOM

Active

251

$644,363

$0

57

Pending

106

$629,990

$0

44

Sold

108

$612,500

$603,510

33

Sold 2021

189

$629,950

$630,000

8

January-23


# Listings

List Price

Sale Price

DOM

Active

210

$649,995

$0

56

Pending

169

$619,990

$0

37

Sold

80

$627,006

$599,995

42

Sold 2022

133

$601,000

$610,000

8

.

.

I want to put you in the best possible position to get home at the best price.  I have a method to bring you the best price possible on a home without over-biding.  Please feel free to give me a call, text, or email to find out how my method works.
.


We can put a plan together to save you as much money as possible in these circumstances.  It is possible that waiting to buy or sell a home may help you have more fruit later.  Your family home is one of your most significant investments.  It's my job to ensure that it yields the highest ROI.  That means making smart decisions that will produce fruit in the future.  Planning is the best way to make this happen.

Posted in Real Estate News
Jan. 26, 2023

Senior care resources for Sacramento, California

Sacramento, the capital city of California, is recognized as one of the most ethnically diverse cities in the nation. As Sacramento's population continuously grows, so does the concern of having a risk of cognitive impairment in our senior population. In fact, 1 out of 10 adults over the age of 65 has Alzheimer's disease. It is now becoming a serious and growing problem.
As a loved one continues to progress through the stages of Dementia, his or her cognitive skills will start to decline. It will be the start of having behavioral problems and safety risks and, in general, would need more than one caregiver to handle. This is when it’s important to find extra help, and residential facilities that have specialized memory care programs are often the best solution.
If I may suggest, use the word "Sacramento and nation" from the last part to include the links.
Posted in Real Estate News
Dec. 14, 2022

Roseville Housing Market Data as of December 2022

Roseville’s Housing Market Numbers for November 2022

.

Median Housing Market Data

.

Roseville home prices are down 4%.  This is comparing November home sales this year to November last year.  From September 2022 to November, home prices are down 5%.

.

In a declining housing market, it's very important to price your home at or below your competition.  Remember, the price drops monthly if your home is listed and on the market.  If the house has been on the market for more than 30 days, the price has now dropped another $10,000 roughly.  You will want to get ahead of this declining housing market to put more money in your pocket.

.

In red below shows home sales continuing to decline.  In most housing market conditions, it's normal for the market to be flat.

.

The active listings are also dropping.  This is normal this time of year.  As well as the DOM continuing to increase.  Many home sellers will take their homes off the market during the holiday season.  Fewer homebuyers are looking to purchase a home during the holiday season.  December is a great time to buy a house and extend the escrow period to mid-January.  This way, the seller and buyer can get through the holidays.

.

There have been fewer home sales this year compared to last year.  In November this year, 129 homes were sold.  Last year in November, 193 homes sold.  This is highlighted in blue below.

.

With a declining housing market, it's essential to do the little things to help sell your home.  Price your house at or below your competition.  And do the little things on the list below.


See the Do's and Don't here!

.

For more housing information, visit my blog at https://www.allcahomes.com/blog/

.


September-22


# Listings

List Price

Sale Price

DOM

Active

383

$669,900

$0

37

Pending

213

$639,900

$0

24

Sold

164

$649,250

$635,000

22

Sold 2021

207

$619,900

$625,000

7

October-22


# Listings

List Price

Sale Price

DOM

Active

331

$674,900

$0

40

Pending

175

$628,670

$0

25

Sold

160

$625,000

$622,500

24

Sold 2021

198

$595,000

$610,000

8

November-22


# Listings

List Price

Sale Price

DOM

Active

289

$659,990

$0

54

Pending

139

$617,312

$0

31

Sold

129

$600,000

$604,000

25

Sold 2021

193

$625,000

$629,000

8

Posted in Real Estate News
Dec. 14, 2022

Citrus Heights Housing Market Data for November 2022

Citrus Heights Housing Market Data for November 2022

Median Housing Market Data    🏡

.

Citrus Heights housing prices are up 1%.  This is comparing November home sales this year to November last year.  From September to November, home prices are up 3%.  Most of the Sacramento area prices are dropping.

.

I was looking at the list price and sales price highlighted in blue below.  The sales price is less than the list price.  The gap between these is getting larger.  This indicates that home prices are dropping.

.

Multiple offers are one factor in increasing housing prices.  In November, 39% of the homes sold had more than one offer.  Last year in November, 54% had more than one offer.  Another factor distorting the multiple offers is the number of homes on the market.  Homebuyers know they have other homes to put an offer on today.  Last year not so much.

.

Many homebuyers are not looking to purchase anymore. They are comparing the number of homes sold in November this year to last year.  The total number of sales is much less this year. Interest rates have increased, which makes their home payments go up.

.

In a declining housing market, it's very important to price your home at or below your competition.  Remember, the price drops monthly if your home is listed and on the market.  If the house has been on the market for more than 30 days, the price has now dropped another $10,000 roughly.  You will want to get ahead of this declining housing market to put more money in your pocket.

.

With a declining housing market, it's important to do the little things to help sell your home.  Price your house at or below your competition.  And do the little things on the list below.


See the Do's and Don't here!

.

For more housing information, visit my blog at https://www.allcahomes.com/blog/

.


September-22


# Listings

List Price

Sale Price

DOM

Active

113

$503,000

$0

34

Pending

74

$477,500

$0

22

Sold

65

$462,000

$460,000

11

Sold 2021

94

$464,950

$477,500

8

October-22


# Listings

List Price

Sale Price

DOM

Active

106

$499,000

$0

35

Pending

63

$459,000

$0

25

Sold

55

$475,000

$468,900

22

Sold 2021

110

$459,950

$474,000

8

November-22


# Listings

List Price

Sale Price

DOM

Active

99

$484,900

$0

29

Pending

56

$445,000

$0

26

Sold

56

$488,495

$472,000

29

Sold 2021

81

$460,000

$467,000

7

Posted in Real Estate News
Dec. 14, 2022

Fair Oaks Housing Market Data for November 2022

Fair Oaks Housing Market Data for November 2022

.

Median Housing Market Data

.

Fair Oaks housing prices are down 7% from November of last year.  These numbers are in red below.  From September to November, Fair Oaks housing prices are down 13%.  The housing market is dropping around the Sacramento area.

.

Looking at other important numbers.  The active listings (inventory) are down.  This is normal this time of year.  Inventory should start to increase in February in most cases.  The DOM is going up.  This is also normal at this time of year.  This is highlighted in blue below.

.

The number of home sales has dropped considerably, and last year, in November, 47 homes sold.  This year 17.

.

Multiple offers have jumped around in Fair Oaks.  Of the homes currently pending (under contract), 38%.  Last month 18% of the pending had more than one offer.

.

Of the homes that sold in November, 24% had more than one offer.  Last month 48%.  Last year 64% had more than one offer.  This is one factor that drives housing prices up.  However, because active inventory is high, the multiple offers do not impact housing prices.  The home buyers have other options if their request is not accepted.

.

In a declining housing market, it's very important to price your home at or below your competition.  Remember, prices drop monthly if your home is listed and on the market.  If the house has been on the market for more than 30 days, the price has now dropped another $10,000 roughly.  You will want to get ahead of this declining housing market to put more money in your pocket.

.

With a declining housing market, it's important to do the little things to help sell your home.  Price your house at or below your competition.  And do the little things on the list below.


See the Do's and Don't here!

.

For more housing information, visit my blog at https://www.allcahomes.com/blog/.

.


September-22


# Listings

List Price

Sale Price

DOM

Active

73

$685,000

$0

31

Pending

31

$600,000

$0

31

Sold

39

$599,000

$593,500

9

Sold 2021

69

$539,000

$545,000

8

October-22


# Listings

List Price

Sale Price

DOM

Active

77

$650,000

$0

33

Pending

17

$647,000

$0

21

Sold

27

$638,000

$630,000

20

Sold 2021

58

$619,500

$622,500

13

November-22


# Listings

List Price

Sale Price

DOM

Active

64

$674,500

$0

44

Pending

29

$625,000

$0

44

Sold

17

$519,000

$519,000

29

Sold 2021

47

$545,800

$557,500

7

Posted in Real Estate News