
Antelope Housing Market Data for January 2023
.
Median Housing Market Data
.
Home prices in Antelope have dropped 6% from January last year. Home prices have been flat since September. The biggest number that jumps out is the total number of home sales (highlighted in blue).
.
The one big concern is where the housing market is headed. There has been a drastic drop in the total number of home sales. Over the last 6 months, there have been 214 homes sold in Antelope. Last year during the same time, 351 homes sold. This year's housing market will be much slower due to the higher interest rates. Home prices will continue to drop slightly.
.
With the higher interest rates, homebuyers have either stopped looking. Or Homebuyers are looking at less expensive homes.
.
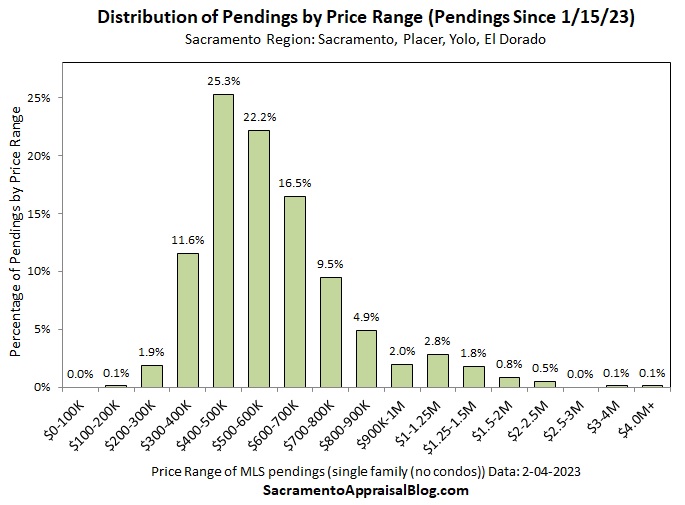
The chart below shows all the homes pending from January 15th in Sacramento County. The sweet spot is from 400k to 500k. Ryan Lundquist, a Sacramento area appraiser, completed this chart.
https://www.facebook.com/SacramentoAppraiser
.
The active listings and the DOM are looking normal this time of year. The Active listings drop during the holidays. For two reasons, lack of homebuyers and the holidays. This number should start to climb in March. The DOM normally goes up this time of year. This is for the same reasons as the active listings. The DOM should start to decrease in March.
.
The best time to sell a home is from March to June. March is when the housing market usually starts to take off. Once the children go back to school, there are fewer homebuyers.
.
For more housing information, visit my blog at https://www.allcahomes.com/blog/.
.
|
November-22 |
||||||||
|
|
# Listings |
List Price |
Sale Price |
DOM |
||||
|
Active |
62 |
$501,000 |
$0 |
44 |
||||
|
Pending |
30 |
$482,500 |
$0 |
33 |
||||
|
Sold |
28 |
$464,500 |
$453,250 |
26 |
||||
|
Sold 2021 |
46 |
$499,500 |
$505,000 |
7 |
||||
|
December-22 |
||||||||
|
|
# Listings |
List Price |
Sale Price |
DOM |
||||
|
Active |
37 |
$489,900 |
$0 |
39 |
||||
|
Pending |
20 |
$499,900 |
$0 |
36 |
||||
|
Sold |
30 |
$477,500 |
$462,500 |
36 |
||||
|
Sold 2021 |
52 |
$475,000 |
$499,950 |
10 |
||||
|
January-23 |
||||||||
|
|
# Listings |
List Price |
Sale Price |
DOM |
||||
|
Active |
34 |
$499,998 |
$0 |
33 |
||||
|
Pending |
26 |
$482,000 |
$0 |
21 |
||||
|
Sold |
17 |
$480,000 |
$475,000 |
28 |
||||
|
Sold 2022 |
40 |
$502,500 |
$511,000 |
9 |
||||
.
.
I want to put you in the best possible position to get a home at the best price. I have a method to bring you the best price possible on a home without over-biding. Please feel free to give me a call, text, or email to find out how my system works.
.
We can put a plan together to save you as much money as possible in these circumstances. It is possible that waiting to buy or sell a home may help you have more fruit later. Your family home is one of your most significant investments. It's my job to ensure that it yields the highest ROI. That means making smart decisions that will yield fruit in the future. Planning is the best way to make this happen.