Aug. 3, 2021

Rosevlle/Rocklin Housing market Data for July 2021

Roseville Housing Market Data

Roseville California Current Housing Market Conditions for July 2021

Average Housing Market Data

The data below is using the average housing market data.  I used the last 3 months to show what is happening and how it is affecting the housing market in general.  In the Active column I put the number in red to show you how the inventory is increasing which is affecting other parts of the housing market.  You can see that in May there was 76 active listings for sale, in June it went up to 116 and in July it went to 141.  Now look at DOM (Day on Market) and sales price.  You can see that DOM highlighted in yellow is going up which is normal with more inventory.  But look at what is happening to the sales price of the homes.  This is in pink, and you can clearly see housing prices are dropping.   With more inventories brings fewer multiple offers therefore lowering housing prices.  Of the homes that sold in July 73% had multiple offers and of the homes currently pending only 58% had multiple offers.  In comparing housing price with July this year to July of last year housing prices are up 21%. 


Normally this time of year we see inventory go down some and DOM go up as well.  Once the children go back to school or when it gets close the housing market changes some. 

May-21


# Listings

Orig Price

List Price

Sale Price

DOM

Active

76

$647,289

$646,492

$0

16

Pending

242

$593,471

$594,505

$0

9

Sold

228

$634,811

$637,190

$668,230

8

Sold 2020

169

$502,847

$498,481

$495,021

22

June-21


# Listings

Orig Price

List Price

Sale Price

DOM

Active

116

$643,651

$642,186

$0

16

Pending

242

$602,499

$602,619

$0

11

Sold

230

$602,781

$604,051

$637,383

7

Sold 2020

249

$520,435

$515,501

$515,252

20

July-21


# Listings

Orig Price

List Price

Sale Price

DOM

Active

141

$660,426

$655,023

0

19

Pending

242

$625423

$623877

0

12

Sold

235

$599737

$599321

$623558

11

Sold 2020

273

517976

515620

515462

21

Median Housing Market Data


Median housing market data was used in the data below.  I do believe this is a better and more true number.  The number of active listings does not change.  Again, while the data shows slightly different numbers in DOM and sale price it is still showing the same information.  Housing prices are dropping, and the DOM is going up.  In comparing housing prices of July this year to July last year prices are up 20%

May 21


# Listings

List Price

Sale Price

DOM

Active

76

$644,450

0

6

Pending

242

$575,000

0

6

Sold

228

$599,900

$646,000

5

Sold 2020

169

$469,000

$468,000

13

June-21


# Listings

List Price

Sale Price

DOM

Active

116

$624,925

0

8

Pending

242

$577,500

0

6

Sold

230

$595,000

$623,500

5

Sold 2020

249

$499,000

$499,000

11

July-21


# Listings

List Price

Sale Price

DOM

Active

141

$635,000

$0

11

Pending

242

$604,000

$0

7

Sold

235

$565,000

$590,000

6

Sold 2020

273

$495,000

$492,000

11

In the data below I’m comparing data going back 6 months this year to the same time last year.  This is interesting because you can see last year from June to July the housing prices were mostly flat.  They went from $485,000 to $486,000.  But now look at Data this year.  June went from $595,000 to $600,000 in July.  In comparing the last 6 months of this year to the same time last year shows that housing prices are up 24%.


Roseville

Home Sales last 6 months


# of Sales

Median List Price

Median Sales Price

DOM


 June 20

1034

$485,000

$485,000

10

 June 21

1180

$569,000

$595,000

5

 July 20

1178

$489,000

$486,000

9

 July 21

1296

$574,450

$600,000

5


Rocklin Housing Market Data

Rocklin California Current Housing Market Conditions for July 2021

Average Housing Market Data

The housing market data below is using the average data.  I used the last 3 months to show what is happening and how it is affecting the housing market in general.  Roseville has seen a much larger uptick is active listings sooner which has affected their housing prices a little more quickly than Rocklin.  You can see in the active and in red below the number of listings is going up or there is an increase in inventory.  Looking at the DOM (days on market) in yellow below you can see that homes are starting to see more time on the market.    Notice that the housing price drops from June to July this year.  That is highlighted in pink.  This is from less multiple offers on homes.  The homes that sold in July pend pending back in June or even May had Multiple offers on 69% while the homes pending which was more in July or sooner only had multiple offers on 59%.  This is the price decrease you see.  In comparing July homes sales this year to July home sales of last year housing prices are up 23% in Rocklin.   


May-21


# Listings

Orig Price

List Price

Sale Price

DOM

Active

32

$756,772

$758,459

$0

11

Pending

128

$726,268

$729,891

0

14

Sold

127

$676,292

$677,367

$707,796

8

Sold 2020

61

$595,236

$591,882

$587,011

21

June-21


# Listings

Orig Price

List Price

Sale Price

DOM

Active

41

$711,687

$708,002

$0

12

Pending

134

$667,923

$668,285

$0

11

Sold

121

$723,961

$727,248

$757,588

12

Sold 2020

97

$575,025

$570,473

$568,783

27

July-21


# Listings

Orig Price

List Price

Sale Price

DOM

Active

79

$709,339

$700,650

$0

14

Pending

122

$684,595

$684,417

$0

13

Sold

107

$673,999

$672,610

$700,689

9

Sold 2020

150

$577,399

$570,717

$570,661

32

Median Housing Market Data

Using the median housing market data below.  I do feel this is a more accurate or true number then the average.  The active listing does not change.  The DOM is going up which is normal with inventory going up.  Now look at the sales price in pink in June and July.  You can see that the sales prices are dropping.  This is being caused by more inventory and less multiple offers on houses.  In Rocklin comparing July this year to July last year housing prices are up 21%. 


May-21


# Listings

List Price

Sale Price

DOM

Active

32

$714,900

0

6

Pending

128

$659,761


6

Sold

127

$630,000

$659,990

6

Sold 2020

61

$549,900

$549,500

11

 June-21


# Listings

List Price

Sale Price

DOM

Active

41

$650,000

0

8

Pending

134

$635,000

0

6

Sold

121

$650,000

$690,000

6

Sold 2020

97

$545,000

$545,000

18

July-21


# Listings

List Price

Sale Price

DOM

Active

79

$659,900

$0

9

Pending

122

$638,900

$0

7

Sold

107

$635,000

$650,000

6

Sold 2020

150

$535,020

$537,500

17

The data below is comparing the last 6 months this year to the same time last year.  This is using the median housing market data.  In blue you can see that June to July last year prices were flat.  This year however Looking at June this year to July this year in red there is an increase in prices.  Using this data home prices are up 20% in Rocklin. 


Rocklin

Home Sales last 6 months


# of Sales

Median List Price

Median Sale Price

DOM

 June 20

403

$525,000

$525,000

13

 June 21

603

$599,000

$620,000

6

 July 20

484

$526,346

$527,750

13

 July 21

655

$609,995

$635,000

6

I have a system put on place to get you the best price possible on a home without over biding.  I want to put you in the best possible position to get a home at the best price.  Please feel free to give me a call, text or email me to find out how my system works. 

It is time to put a plan together to save you as much money as possible in these circumstances.  It is possible that waiting may make more sense for you then purchasing now.  Planning is the best way to save some money.
Posted in Real Estate News
Aug. 1, 2021

Some Sacramento Area Housing Market Data

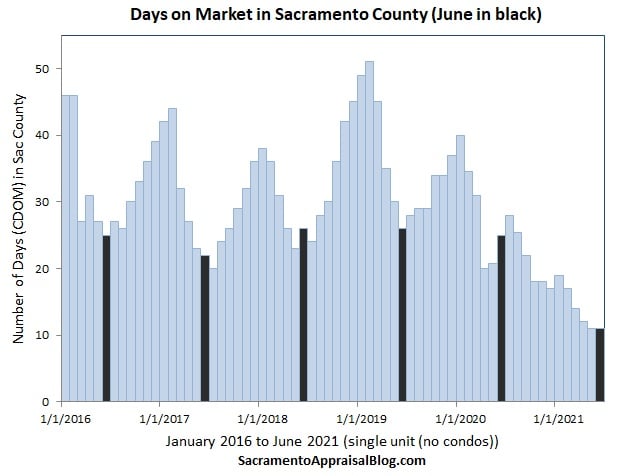
Could it be true are home prices finally starting to slow down? It appears that the housing market in Sacramento is starting to peak for the season. It is normal this time of year for housing prices to take a dip price wise. It’s always better to sell your home during the prime selling season no matter what the housing market is doing. You will always receive more for your home. Anything to add? 

This data is from Ryan Lundquist - Real Estate Appraiser

This chart shows housing prices by months. You can see that the Black bar shows a decline is sales price in the month of July in most years.

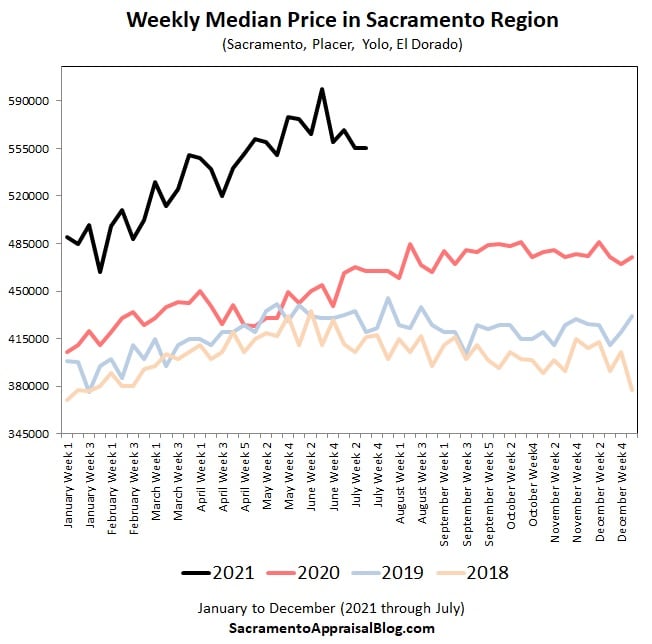
This chart shows home prices dropping.


This is a good sign if you are thinking about buying a home. Please feel free to call, text or call with any questions. Remember if you are thinking about selling you may want to think twice.

Posted in Real Estate News
June 29, 2021

Some Current Housing Market Data

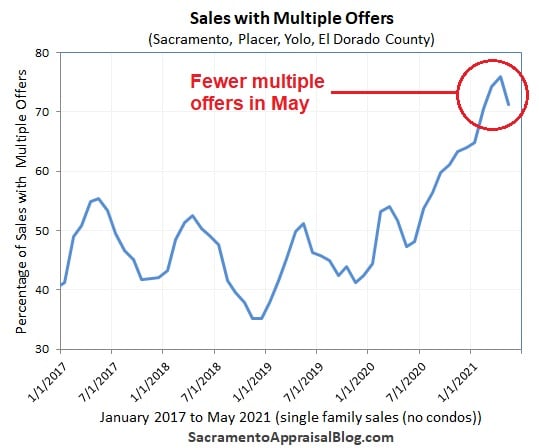
This could be the start of the housing market starting to come back to reality or just a hiccup.   Time will tell but if it continues it will mean that the housing prices will start to level off and properties will sit longer on the market before, they sell.  This time of year, it is completely normal for the housing market to act in this way.  If you are thinking of buying or selling a home, please feel free to contact me so you can make the best decision for you and your family.


This graph was completed by Ryan Lundquist a local Sacramento area appraiser.


Posted in Real Estate News
June 8, 2021

Rocklin CA Housing Market Data for May 21

Rocklin Housing Market Data

Housing prices continue to shoot upward.  Will the housing market slow down when the children begin to go back to school like a normal housing cycle?  We will, see?  Housing prices are up 21% when comparing May of 2020 to May of 2021.  In May of 2020, the selling price was below list price and sat of the market for 21 days.  This indicates the multiple offers are not happening currently.  Now looking at May of 2021 the selling price is much higher than the list price.  This indicates that there are multiple offers going on and the DOM (days on market) is much less as well. 


Average Housing Market Data


May-21


# Listings

Orig Price

List Price

Sale Price

DOM

Active

32

$756,772

$758,459

$0

11

Pending

128

$726,268

$729,891

0

14

Sold

127

$676,292

$677,367

$707,796

8

Sold 2020

61

$595,236

$591,882

$587,011

21


In the current housing market conditions, I believe that the median housing data is more accurate.  Using this data housing prices are up 20% in Rocklin when comparing May of 2020 to May of 2021.  In May of 2020, the selling price is at list price which indicates no or few multiple offers going on.  In May of 2021, the selling price is much higher than the list price indicating multiple offers.  Also, homes are selling in about half the time this May compared to last May.


Median Housing Market Data


May-21


# Listings

List Price

Sale Price

DOM

Active

32

$714,900

0

6

Pending

128

$659,761


6

Sold

127

$630,000

$659,990

6

Sold 2020

61

$549,900

$549,500

11


In comparing the last 6 months of sales this year to the same time last year housing prices are up 16%.  Many people took their homes of the market last year because of Covid.  Last year homes sold below asking while this year they sold for much higher then asking. 


Rocklin

Home Sales last 6 months


# of Sales

Median List Price

Median Sale Price

DOM

 May 20

389

$515,000

$510,000

15

 May 21

592

$575,000

$590,000

6

I have a system put on place to get you the best price possible on a home without over biding.  I want to put you in the best possible position to get a home at the best price.  Please feel free to give me a call, text or email me to find out how my system works. 

Please feel free to give me a call, text, or email so we can put a plan together to save you as much money as possible in these circumstances.  It is possible that waiting may make for sense for you then purchasing now.  Planning is the best way to save some money.
Posted in Real Estate News
June 8, 2021

Roseville CA Housing Market Data for May 21


Roseville Housing Market Data


The housing is unbelievable right now.  Will the housing market slow down as we approach the children going back to school?  In a normal housing market, it will slow down once the children begin to return to school.  This is because parents want the children in the area before school starts.  In May the housing prices have increased 35% in May this year compared to May of last year.  You can see below that May of 2020 the sales price was below listing price.  This indicates that there were not multiple offers going on.  A more level housing market.  In May of 2021 you can see that the sales price is way above the list price indicating multiple offers which again is driving housing prices up.  How long can this continue, who knows.


Average Housing Market Data 

May-21


# Listings

Orig Price

List Price

Sale Price

DOM

Active

76

$647,289

$646,492

$0

16

Pending

242

$593,471

$594,505

$0

9

Sold

228

$634,811

$637,190

$668,230

8

Sold 2020

169

$502,847

$498,481

$495,021

22


I feel that the median numbers are the most accurate at this time and in these circumstances.  Housing prices are up 38% using this data and comparing May of 2020 to May of 2021.   You can see that in May of the 2020 the selling price is about the same as the list price.  This again indicates that multiple offers were not happening.  In May of 2021 you can see that the sales price is way above the list price again indicating multiple offers driving prices up.  Pricing your home in this market is especially important to get top dollar.  Over pricing may mean you get less than you could have. 


Median Housing Market Data


May 21


# Listings

List Price

Sale Price

DOM

Active

76

$644,450

0

6

Pending

242

$575,000

0

6

Sold

228

$599,900

$646,000

5

Sold 2020

169

$469,000

$468,000

13


Below you can see that in May of 2020 homes sold for about what was being ask in the list price.  However, in May of 2021 the selling price is about $25,000 over asking.  Multiple offers again causing this.  Over the last 6 months coming the same time from this year to last year housing prices are up 20%.


Roseville

Home Sales last 6 months


# of Sales

Median List Price

Median Sales Price

DOM

 May 20

970

$481,127

$480,000

12

 May 21

1165

$550,000

$575,000

5

Posted in Real Estate News
May 15, 2021

Roseville/Rocklin Housing Market Data

Roseville Housing Market Data


In the chart below we are using the average housing market data.  Prices continue to rise sharply.  In comparing April sales of 2020 to April sales of 2021, you can see that the prices have drastically increased.  Up an amazing 21%!  You can see that in April of 2020 home sellers had to drop the price some to get it sold.  You can see that in comparing Original Price to the List Price.  You can also see the Selling Price is less than the List Price which means that there were fewer buyers and not many multiple offers happening.  During this time homes sat on the market for 18 days before they received an offer.  Remember these are average numbers.  In looking at the data for this year you see that sellers have raised the price before it goes pending.  This biggest thing I see is the List Price to the Sale Price.  Properties are selling for 4% above asking.  This is cause be multiple offers not the seller setting the price. 


This also was the time when Covid-19 started to become a factor in the United States.


Average


April-21


# Listings

Orig Price

List Price

Sale Price

DOM

Active

89

$673,311

$674,305

$0

12

Pending

235

$628,750

$630,479

$0

9

Sold

239

$592,890

$593,147

$618,533

8

Sold 2020

133

$514,535

$511,518

$511,152

18


In the chart below we are using the median statistics.  Personally, I feel that these numbers are a little more accurate in this market.  You can see that last year homes sold for just over List Price while this year properties are selling for over $25,000 over List Price.  Again, this is cause by multiple offers!!!  There are more home buyers then homes listed which causes an inventory shortage.  Using this data home prices are up 16% from last year.


Median


April 21


# Listings

List Price

Sale Price

DOM

Active

89

$649,500


4

Pending

235

$599,900


5

Sold

239

$550,000

$575,000

5

Sold 2020

133

$487,500

$493,000

8


The chart below is comparing the last 6 months of sales from this year to the same time last year.  This data is using the median data.     Home prices are up 15%.  You can see also that DOM are much higher last year. 


Roseville

Home Sales last 6 months


Number of Sales

Median Ave

DOM

 Apr 20

988

$479,000

13

 Apr 21

1140

$549,000

6


Rocklin Housing Market Data

The chart below is using data averages.  This is comparing the month April in 2020 to April in 2021.  This chart shows that sellers last year were dropping their price of the home to sell.  You see that in the Original Price and List Price.  The Sale Price is less than List Price which indicates that multiple offers were not happening, and you can see that homes sat on the market for 30 days before getting an offer.  The housing prices are up 27% comparing April of 2020 to April of 2021.   Looking at this year’s data you can see that homeowners are raising the price of the home while for sale and that the homes are selling for $30,000 over the List Price.  This is being caused by multiple offers.  Homes are only on the market for 8 days before accepting an offer.  Marketing in this housing market situation is especially important and needs to reach as many buyers as possible to get the highest and best price.


Consult a professional to get the most for your home.  The wrong marketing can hurt you in this market condition.


Average Sale Price


April-21


# Listings

Orig Price

List Price

Sale Price

DOM

Active

44

$805,173

$825,420


22

Pending

148

$669,327

$671,065

$0

12

Sold

99

$633,744

$638,425

$670,208

8

Sold 2020

52

$537,023

$532,362

$528,039

30


In the chart below we are using the Median statistics and still comparing March data of 2020 to March data of 2021.  This is only March numbers.  In the chart you can see that homes are selling for $26.000 over asking.  Again, you can see that homeowners are raising the price while listed which is because they have received an above asking offer.  Especially important, this is being caused be low inventory and selling on your own can cost you thousands. 

Median Sale Price


April-21


# Listings

List Price

Sale Price

DOM

Active

44

$724,450


5

Pending

148

$610,000


6

Sold

99

$599,000

$625,000

5

Sold 2020

52

$512,500

$510,000

11


In the chart below we are comparing the last 6 months of sales from this year to the last 6 months of sales at the same time last year.  Home prices are up 15% from last year. 


Rocklin

Home Sales last 6 months


# of Sales

Median Price

DOM

 Apr 20

410

505000

19

 Apr 21

599

580000

6

I have a system put on place to get you the best price possible on a home without over biding.  I want to put you in the best possible position to get a home at the best price.  Please feel free to give me a call, text or email me to find out how my system works. 

Please feel free to give me a call, text, or email so we can put a plan together to save you as much money as possible in these circumstances.  It is possible that waiting may make for sense for you then purchasing now.  Planning is the best way to save some money.
Posted in Real Estate News
Dec. 16, 2020

Lincoln Housing Market Data

The housing market data in Lincoln is a little misleading.  There are several homes on the market that have been listed over 100 days which spews the day on market.  Also, most of these homes are listed over 1 million dollars which is skewing the market data to the higher side price wise in the active market listings.  The average price has the Lincoln housing market up about 9% comparing November 2020 to November 2019.  Also, you can see that homes are selling much faster when you look at days on market November 2020 to November 2019 is 18 to 37.    

Lincoln

November-20


Active Listings

Orig Price

List Price

Sale Price

DOM

Active

82

$910,273

$896,843


58

Pending

117

$573,558

$571,665


24

Sold 2020

90

$553,642

$551,813

$558,073

18

Sold 2019

87

$532,072

$518,173

$512,599

37


Lincoln

Home Sales last 6 months


Number of Sales

Average Price

Median

DOM

November 19

540

$526,719

$485,000

30

November 20

738

$548,695

$491,500

27

If you look at this data, it shows that there is a big difference from the Average sales price and the Median sales price.  The higher priced homes have skewed the market to the higher side.  Over the last 6 months the days on market is almost the same for 2020 to 2019.  

Dec. 16, 2020

Current Housing Market Statistics for Roseville and Rocklin

Roseville California Real Estate Market Conditions as of December 2, 2020

Roseville
September-20
  # Listings Orig Price List Price Sale Price DOM
Active 118 $603,879 $598,685   32
Pending 298 $542,815 $541,339   20
Sold 252 $544,740 $540,705 $545,915 20
Sold 2019 196 $496,475 $490,911 $486,705 29
October-20
  # Listings Orig Price List Price Sale Price DOM
Active 121 $618,813 $614,506   27
Pending 285 $539,442 $537,772   19
Sold 232 $556,958 $553,852 $561,530 16
Sold 2019 201 $495,987 $488,256 $483,970 27
November-20
  # Listings Orig Price List Price Sale Price DOM
Active 72 $609,858 $604,415   39
Pending 252 $562,126 $559,010   17
Sold 207 $540,453 $538,067 $542,038 16
Sold 2019 187 $479,163 $472,574 $467,484 31
Rocklin
September-20
  Active Listings Orig Price List Price Sale Price DOM
Listing 90 $635,523 $633,740   36
Pending 171 $564,234 $561,775   17
Sold 107 $554,247 $554,130 $563,567 17
Sold 2019 88 $527,101 $517,268 $512,617 34
October-20
  # Listings Orig Price List Price Sale Price DOM
Active 91 $654,130 $648,045   36
Pending 162 $586,983 $559,189   17
Sold 126 $564,591 $560,669 $564,212 20
Sold 2019 87 $557,680 $549,365 $543,811 27
November-20
  # Listings Orig Price List Price Sale Price DOM
Active 47 $634,939 $632,254   53
Pending 134 $582,106 $580,220   18
Sold 125 $571,419 $569,014 $576,756 18
Sold 2019 83 $524,523 $512,757 $508,014 45


New home listings generally drop this time of year because of the holidays. This usually starts to happen around October of each year and goes through December before the listing begin to rise. This data shows up in the # Listings above. This happened later this year most likely from the price increases that have been happening. We are now starting to see fewer listings because of the holidays. Inventory is already low. Comparing home sales in Roseville for November 2019 to 2020 there was a 16% rise in price (above data) and comparing the last 6 months of home sales there has been a 9% increase in home prices (data below). Comparing home sales in Rocklin for November 2019 to 2020 there was a 14% rise in home price (above data) and comparing the last 6 months of home sales there has been a 9% increase in home prices (data below).This is being driven by low inventory, low interest rates and more home buyers with a large uptick in bay area families moving to the Sacramento area.

Roseville
Home Sales last 6 months
  Number of Sales Average Price
October 2019 1375 $495,507
October 2020 1486 $529,079
November-19 1307 $490,157
November-20 1528 $534,403
Rocklin
Home Sales last 6 months
  Number of Sales Average Price
October 2019 628 $526,248
October 2020 693 $571,865
November 19 594 $522,296
November 20 757 $571,452


Please feel free to give me a call, text or email so we can put a plan together to save you as much money as possible in these circumstances. It is possible that waiting may make for sense for you then purchasing now. Planning is the best way to save some money.

Aug. 4, 2020

Experts Weigh-In on the Remarkable Strength of the Housing Market

Experts Weigh-In on the Remarkable Strength of the Housing Market

Experts Weigh-In on the Remarkable Strength of the Housing Market | MyKCM

America has faced its share of challenges in 2020. A once-in-a-lifetime pandemic, a financial crisis leaving millions still unemployed, and an upcoming presidential election that may prove to be one of the most contentious in our nation’s history all continue to test this country in unimaginable ways.

Even with all of that uncertainty, the residential real estate market continues to show great resilience. Here’s a look at what the experts have said about the housing market over the past few weeks.

Ivy Zelman, CEO of Zelman & Associates:

“Whether in terms of pending contract activity or our proprietary buyer demand ratings, the various measures of demand captured in this month’s survey can only be described as shockingly strong, in spite of the resurgence in COVID-19 cases.”

Logan Mohtashami, Lead Housing Analyst at HousingWire:

“Existing home sales are still down year over year by 11.3%, but as crazy as this might sound, we have a shot at getting positive year-over-year growth…We may see an existing home sales print of 5,510,000 in 2020.”

Matthew Speakman, Zillow Economist:

“In a remarkable show of resilience, the housing market has stared the pandemic right in the eye and hasn’t blinked.”

Todd Teta, Chief Product Officer for ATTOM Data Solutions:

“The housing market across the United States pulled something of a high-wire act in the second quarter, surging forward despite the encroaching economic headwinds resulting from the Coronavirus pandemic.”

Ali Wolf, Chief Economist of Meyers Research:

“The housing recovery has been nothing short of remarkable. The expectation was that housing would be crushed. It was—for about two months—and then it came roaring back.”

Clare Trapasso, Senior News Editor of realtor.com:

“Despite the crippling and ongoing coronavirus pandemic, millions out of work, a recession, a national reckoning over systemic racism, and a highly contentious presidential election just around the corner, the residential real estate market is staging an astonishing rebound.”

Bill Banfield, EVP of Capital Markets at Quicken Loans:

“The pandemic has not stopped the consistent home price growth we have witnessed in recent years.”

Economic & Strategic Research Group at Fannie Mae:

Recent home purchase measures have continued to show remarkable strength, leading us to revise upward our home sales forecast, particularly over the third quarter. Similarly, we bumped up our expectations for home price growth and purchase mortgage originations.”

Mark Fleming, Chief Economist at First American:

“It seems hard to deny that when one looks at many of the housing market statistics, a “V” shape is quite apparent.”

Bottom Line

The experts seem to agree that residential real estate is doing remarkably well. If you’re thinking of jumping into the housing market (whether buying or selling), this may be the perfect time.

Posted in Real Estate News
Aug. 4, 2020

Today’s Buyers Are Serious about Purchasing a Home

Today’s Buyers Are Serious about Purchasing a Home

Today’s Buyers Are Serious about Purchasing a Home | MyKCM

Today’s homebuyers are not just talking about their plans, they’re actively engaged in the buying process – and they’re serious about it. A recent report by the National Association of Home Builders (NAHB) indicates:

“…. Of American adults considering a future home purchase in the second quarter of 2020, about half (49%) are not simply planning it, they are actively engaged in the process to find a home. That is a significantly higher share than the comparable figure a year ago (41%), which suggests that the COVID-19 crisis and its accompanying record-low mortgage rates have converted some prospective buyers into active buyers.”

Today’s Buyers Are Serious about Purchasing a Home | MyKCMIt’s no surprise that buyers are out in full force today. Many Americans now need more space to work from home, and the current low mortgage rates are providing an extra boost of motivation to enter the housing market.

If you’re considering selling your house, know that today’s buyers are serious about making a move. Your opportunity to sell your house in a market with high demand is growing, especially as more millennials enter the housing market too. The same report also notes:

Of Millennials planning a home purchase in the next year, 57% are already actively searching for a home.”

Odeta Kushi, Deputy Chief Economist at First American, explains:

“When breaking down house-buying power by educational attainment for millennials in 2019, we find that the higher the education, the higher the household income, and the higher the house-buying power. In 2019, median house-buying power for millennials increased 16 percent relative to 2018.”

As demand for homes to buy grows and more millennials enter the market with growing buying power, the opportunity to sell your house grows too.

Bottom Line

Today’s buyers are serious ones and more millennials are helping to fuel that charge. So, if you’re considering selling your home, let’s connect today to determine your next steps in the process while buyers are actively looking.

Posted in Real Estate News