
Elk Grove Zip Code 95758 Housing Market Data for July 2022
.
Median Home Sales Data
.
First, the housing prices in Elk Grove within the zip code of 95758 are up 👆 15%. This is comparing June home sales this year to June last year. Looking back at the last few months, the home sales have been flat.
.
Now, look at what is happening in the housing market. Remember, we are in the prime housing market season. Any changes in the housing market will appear first in the active listings and pending within the current month.
.
Some of the key housing market data are active listings (inventory), DOM (days on the market), and multiple offers. First, let's look at active inventory. This is highlighted in blue below. It has continued to increase, which is normal this time of year. But it can also happen because of fewer homebuyers.
.
Now let’s look at DOM. This is highlighted in green below. There is a large increase from April to May. This is when the interest rates began to increase substantially. With the increased interest rates, many homebuyers can’t afford the monthly payments now. The homebuyers are either not looking anymore or looking at lower-priced homes.
.
Looking at the multiple offers now. In April the pending homes were at 73% with more than one offer. In May that number dropped to 69%. In June it dropped to 47%. This can be affected by more inventory and fewer homebuyers.
.
The housing market has changed and it’s important to stay ahead. If you are selling, DON’T GET TOO AGGRESSIVE. If you are buying a home, DON’T OVERBID.
.
Want to get top dollar for your home if you are selling. Check out my home selling checklist with valuable tips and information. Home Selling Checklist
.
If you are thinking about moving to a bigger or smaller home but you are worried about having to move twice. I have a method put in place, so you only have to move once. Downsizing my Home - Need a Bigger Home
.
For more housing information, visit my blog at https://www.allcahomes.com/blog/
.
|
April-22 |
||||
|
|
# Listings |
List Price |
Sale Price |
DOM |
|
Active |
48 |
$616,500 |
$0 |
9 |
|
Pending |
67 |
$610,000 |
$0 |
7 |
|
Sold |
49 |
$599,999 |
$630,000 |
6 |
|
Sold 2021 |
43 |
$495,000 |
$525,000 |
5 |
|
May-22 |
||||
|
|
# Listings |
List Price |
Sale Price |
DOM |
|
Active 52 |
50 |
$600,000 |
$0 |
19 |
|
Pending 54 |
54 |
$596,500 |
$0 |
9 |
|
Sold 61 |
56 |
$599,500 |
$625,000 |
7 |
|
Sold 2021 |
63 |
$499,000 |
$542,000 |
6 |
|
June-22 |
||||
|
|
# Listings |
List Price |
Sale Price |
DOM |
|
Active |
76 |
$599,919 |
$0 |
19 |
|
Pending |
49 |
$589,900 |
$0 |
12 |
|
Sold |
42 |
$599,475 |
$631,000 |
9 |
|
Sold 2021 |
66 |
$500,000 |
$547,500 |
6 |
.
Average Housing Market Data
.
Using the average housing market data below. Elk Grove home prices are up 👆 16% in the zip code of 95758.
.
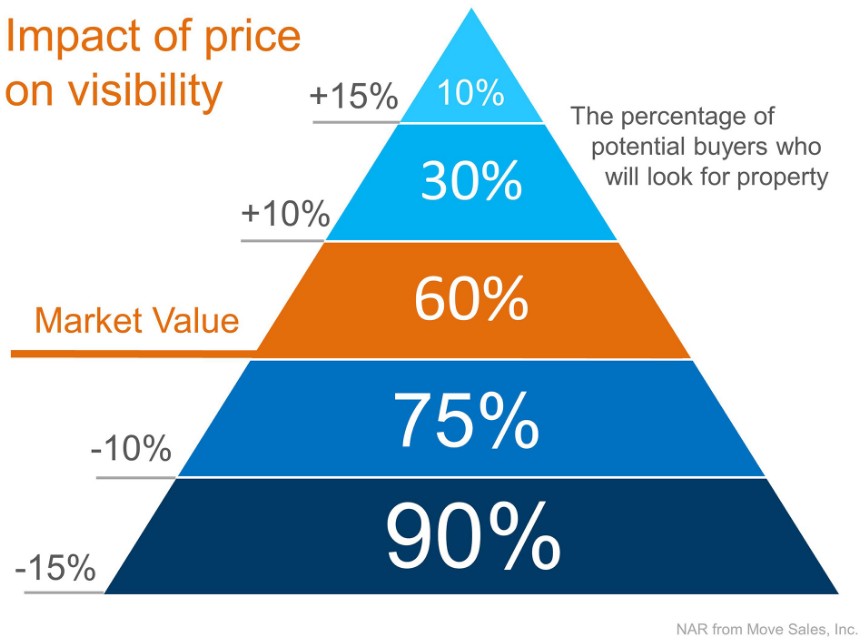
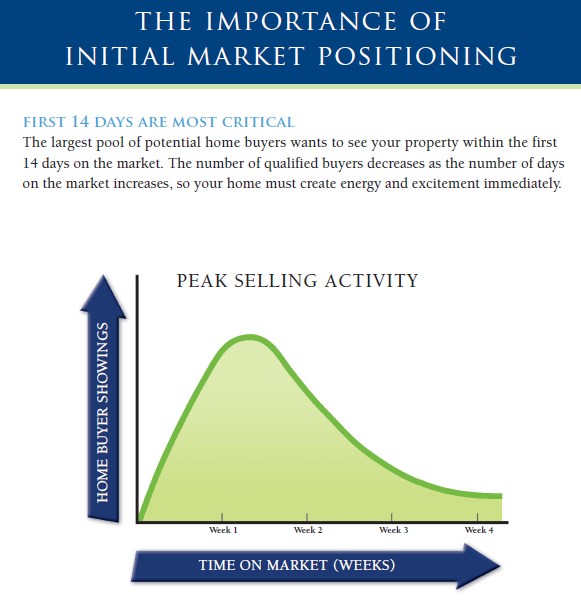
Let’s look at the housing market data that shows some home sellers are not pricing their homes correctly. And how it’s currently hurting them. Go back to the graphs below.
.
The most attention your home will receive is in the first 14 days. If you overprice your home, the homebuyers will not look or even see your home. You are also letting homebuyers know that they can haggle you more. Why? Because they now not that many homebuyers are looking at your home. Looking at the home sales in June (in red). The original price and the list price are close. The list price is higher which means some home sellers increase their home prices.
.
Highlighted in blue below are the active listings. Look at April, May, and June. Notice that the DOM and the price drops follow each other. This shows how important it is to list your home at the correct price. The homes priced correctly are selling and the homes overpriced are not.
.
Here are a couple of graphs of the importance of correct pricing.
.
.
.
Many home buyers will make at least one of these mistakes when buying a home. Don’t let that be you!!!
.
|
April-22 |
|||||
|
|
# Listings |
Orig Price |
List Price |
Sale Price |
DOM |
|
Active |
48 |
$643,055 |
$639,681 |
$0 |
16 |
|
Pending |
67 |
$644,018 |
$641,466 |
$0 |
14 |
|
Sold |
49 |
$612,504 |
$613,155 |
$640,017 |
10 |
|
Sold 2021 |
43 |
$512,254 |
$510,612 |
$532,967 |
9 |
|
May-22 |
|||||
|
|
# Listings |
Orig Price |
List Price |
Sale Price |
DOM |
|
Active |
50 |
$646,270 |
$634,714 |
$0 |
29 |
|
Pending |
54 |
$607,552 |
$608,948 |
$0 |
12 |
|
Sold |
56 |
$650,749 |
$648,053 |
$668,114 |
12 |
|
Sold 2021 |
63 |
$512,093 |
$515,653 |
$556,143 |
13 |
|
June-22 |
|||||
|
|
# Listings |
Orig Price |
List Price |
Sale Price |
DOM |
|
Active |
76 |
$625,390 |
$612,836 |
$0 |
28 |
|
Pending |
49 |
$620,720 |
$604,453 |
$0 |
19 |
|
Sold |
42 |
$627,136 |
$628,319 |
$643,829 |
18 |
|
Sold 2021 |
66 |
$508,613 |
$512,773 |
$553,321 |
9 |
.
This housing market data is comparing the last 6 months of home sales this year to the same time last year. Changes in the housing market don’t show up in the housing data.
.
Housing prices are up 20% in Elk Grove within the zip code of 95758.
.
|
Elk Grove |
||||
|
Home Sales last 6 months |
||||
|
|
# of Sales |
Median List Price |
Median Sales Price |
DOM |
|
Apr-21 |
352 |
$459,000 |
$477,000 |
6 |
|
Apr-22 |
311 |
$575,000 |
$605,000 |
6 |
|
May-21 |
320 |
$469,995 |
$500,000 |
6 |
|
May-22 |
287 |
$595,000 |
$622,000 |
7 |
|
Jun-21 |
308 |
$485,000 |
$520,000 |
6 |
|
Jun-22 |
283 |
$599,000 |
$623,000 |
7 |
I want to put you in the best possible position to get a home at the best price. I have a method to get you the best price possible on a home without over-biding. Please feel free to give me a call, text, or email me to find out how my system works.
.
We can put a plan together to save you as much money as possible in these circumstances. It is possible that waiting to buy or sell a home may help you have more fruit later. Your family home is one of your most significant investments. It's my job to ensure that it yields the highest ROI. That means making smart decisions that will yield fruit in the future. Planning is the best way to make this happen.